
Bitcoin is showing signs of weakness as February draws to a close.

Image courtesy of CoinTelegraph
Bitcoin (BTC) has seen a corrective week as the price dropped from $58,000 to $44,000 in a matter of days. This dropdown caused a panic reaction across the markets as the euphoria was immediately halted.
For instance, the Crypto Fear and Greed Index plunged to monthly lows of 56 after being above 90, or "extreme greed" for an entire month.
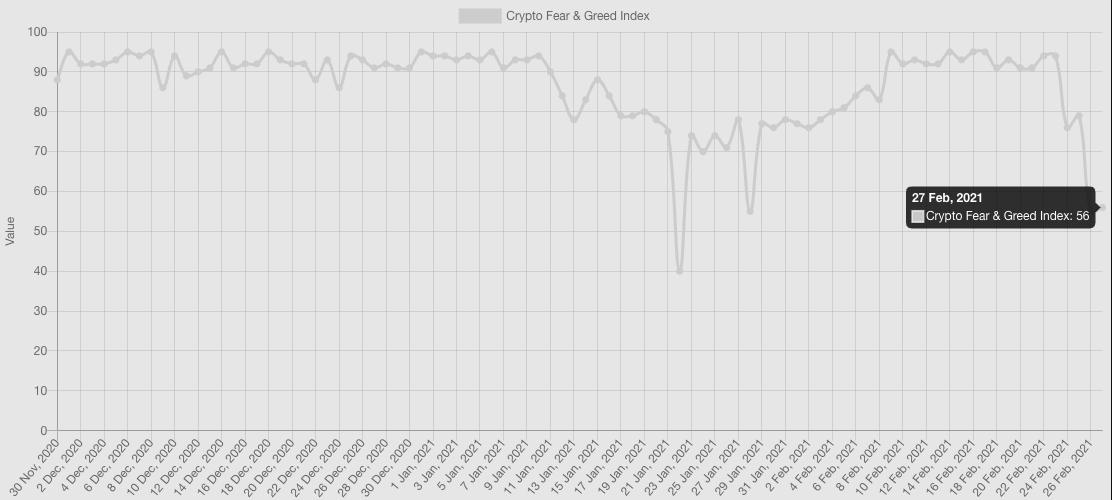
Crypto Fear & Greed Index. Source: Alternative.me (Click image for larger view)
However, such a panic reaction is unwarranted because corrections appear frequently in a bull market as a "reset" before continuation. This is organic and healthy and offers a good opportunity for traders and investors to buy the dip.
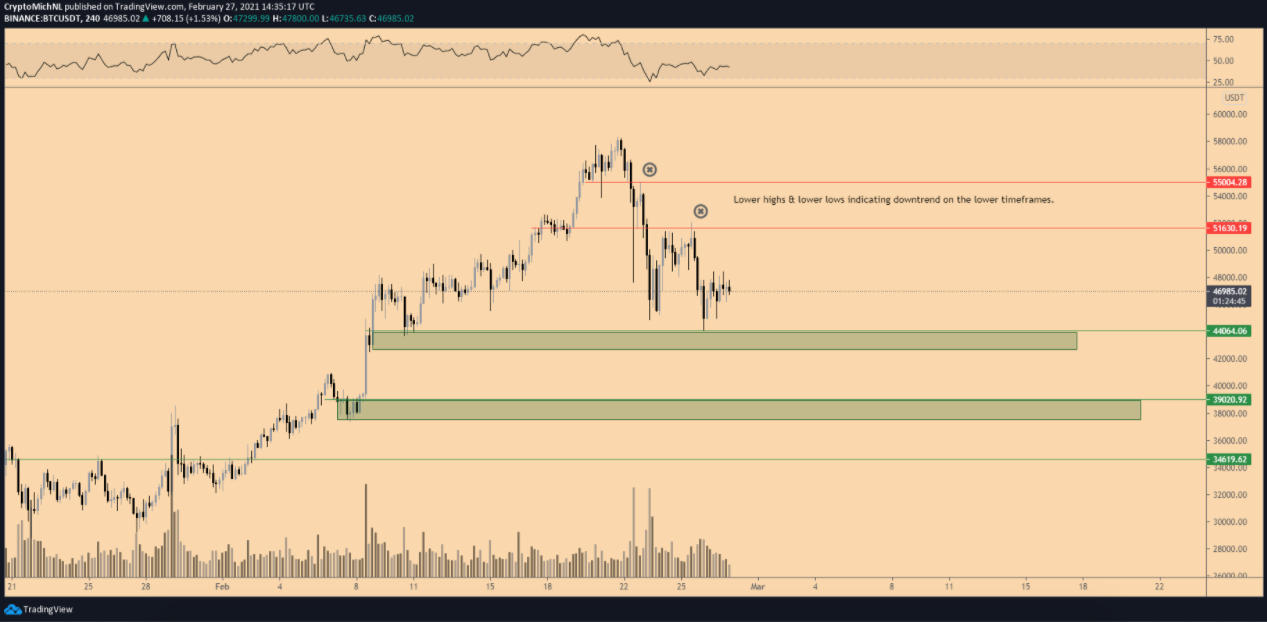
BTC/USDT 4-hour chart. Source: TradingView (Click image for larger view)
The 4-hour chart shows an apparent downtrend since the previous high at $58,000. This high could be the top for the coming months, a period that may see a more prolonged correction.
However, the price action since this top at $58,000 indicates weakness as every support level flips into resistance, indicating further weakness.
The chart shows these flips, where the $55,000 level was the first one. After that, the price of Bitcoin dropped significantly to the support zone around $45,000. This support zone held and resulted in a strong bounce toward $52,000.
But, unfortunately for the bulls, this level wasn't broken and instead saw a rejection, confirming further weakness across the market and more downside for BTC price.
This now paints a clear picture of the critical levels to watch. Ideally, the support zone between $42,500-$44,000 has to hold for further upward momentum. If it fails, further weakness can be expected toward the $37,500-$39,000 level.
But if the $42,500-44,000 support zone holds, higher prices can be expected once Bitcoin breaks above the resistance between $50,000 and $51,000.
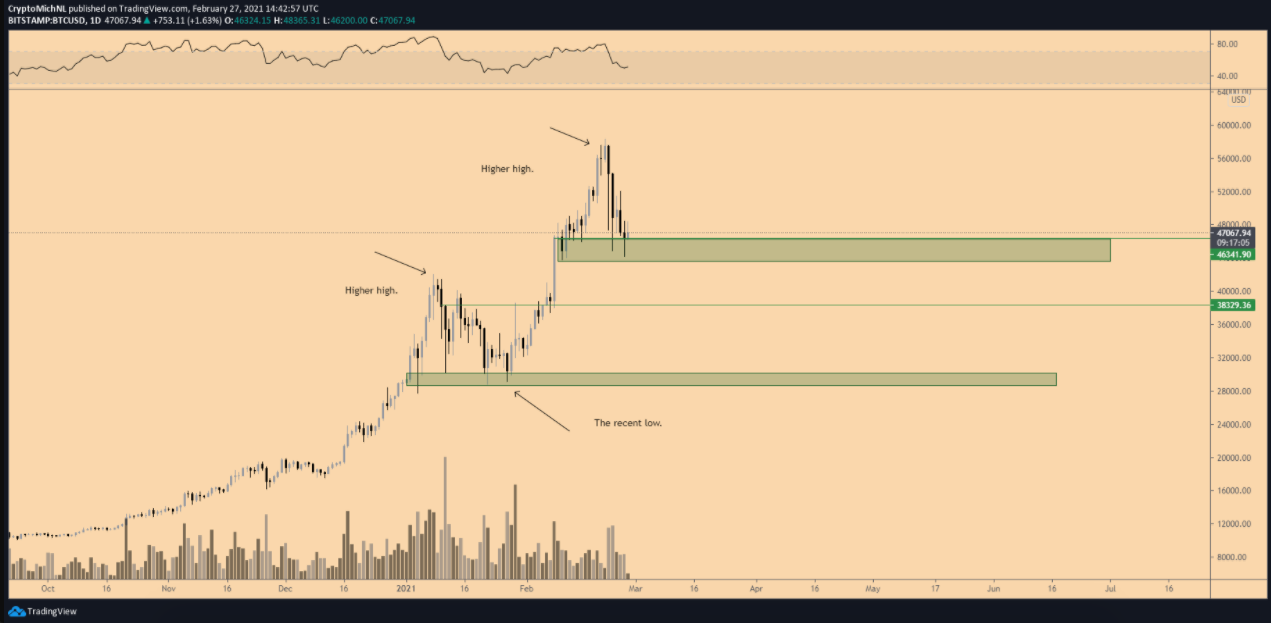
BTC/USD 1-day chart. Source: TradingView (Click image for larger view)
While the lower timeframes indicate weakness for BTC/USD, the higher timeframes suggest a healthy correction. The market construction is still very bullish, as the chart above shows.
The previous top was at $42,000, after which the new support was established at $30,000. This last top was easily broken as Bitcoin’s price accelerated to the $58,000 high. Hence, a correction to even $37,000 could be classified as healthy and organic in this type of bull market.
Simply put, as long as BTC holds above the $30,000 low of January 2021, the market can be classified as bullish.
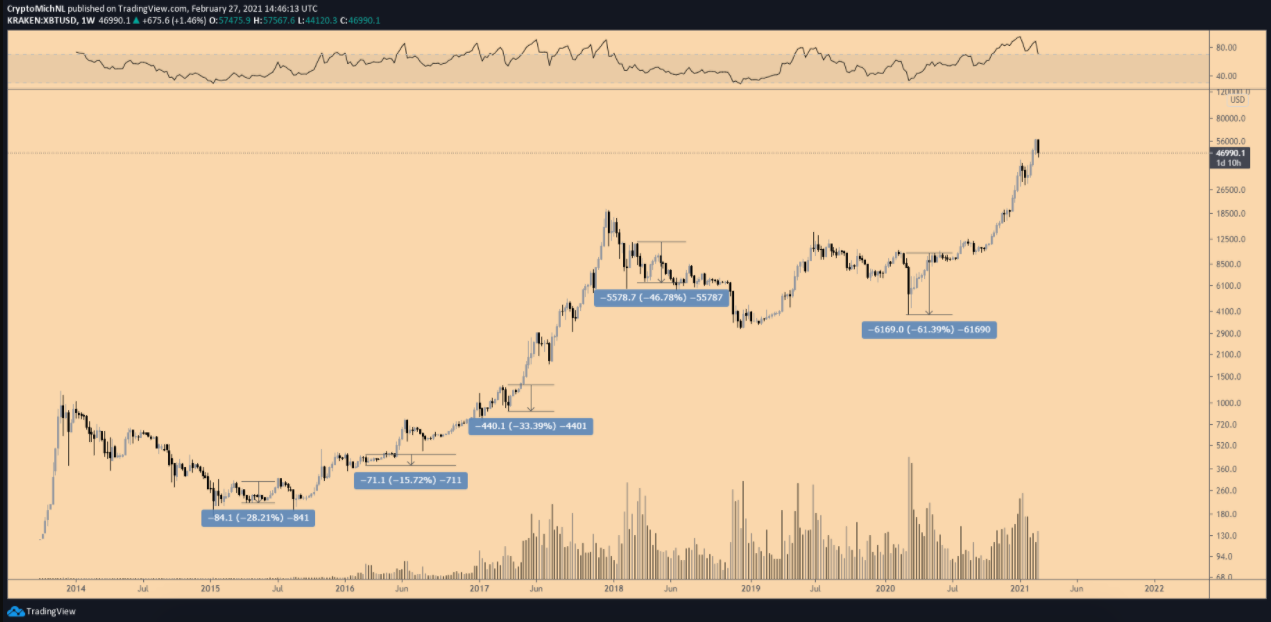
XBT/USD 1-week candle chart. Source: Tradingview (Click image for larger view)
History shows that March isn’t the most bullish month for the cryptocurrency market. In recent years, corrections have been seen in March. Specifically, corrections of 15%-60% happened in 2015, 2016, 2017, 2018, and 2020.
The latest crash was caused by the Covid-19 pandemic and could be classified as a "black swan." Nevertheless, corrections tend to happen in March and this year could also see another pullback.
Therefore, corrections can last for several weeks and are frequently not completed in just one drop. Hence, a correction toward the $35,000-$40,000 is still on the table.
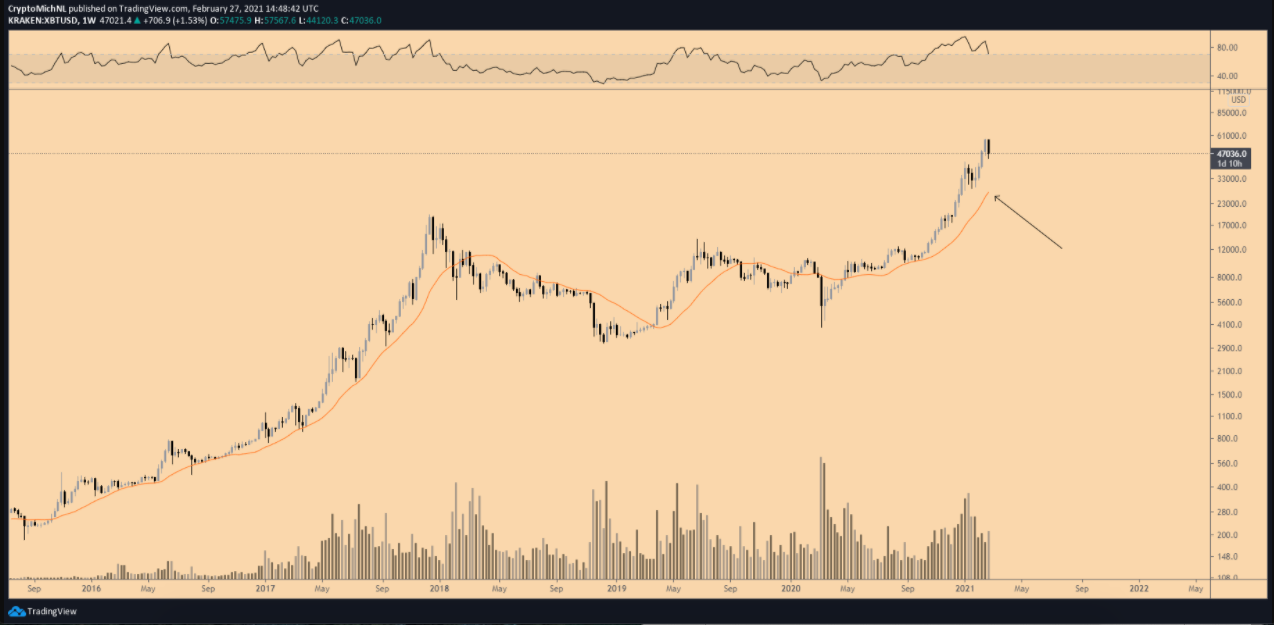
XBT/USD 1-week chart. Source: TradingView (Click image for larger view)
The primary indicator to watch for this is the 21-Week MA. Often, corrections tend to move toward this line as a key point for a potential reversal. Therefore, in the coming weeks, this 21-Week MA could provide support in the correction.
Currently, the 21-Week MA is around $28,000, though this should climb up in the coming weeks toward $33,000-35,000.
The views and opinions expressed here are solely those of the author and do not necessarily reflect the views of Cointelegraph. Every investment and trading move involves risk. You should conduct your own research when making a decision.
Original article posted on the CoinTelegraph.com site, by Michael Van De Poppe.
Article re-posted on Markethive by Jeffrey Sloe
