x




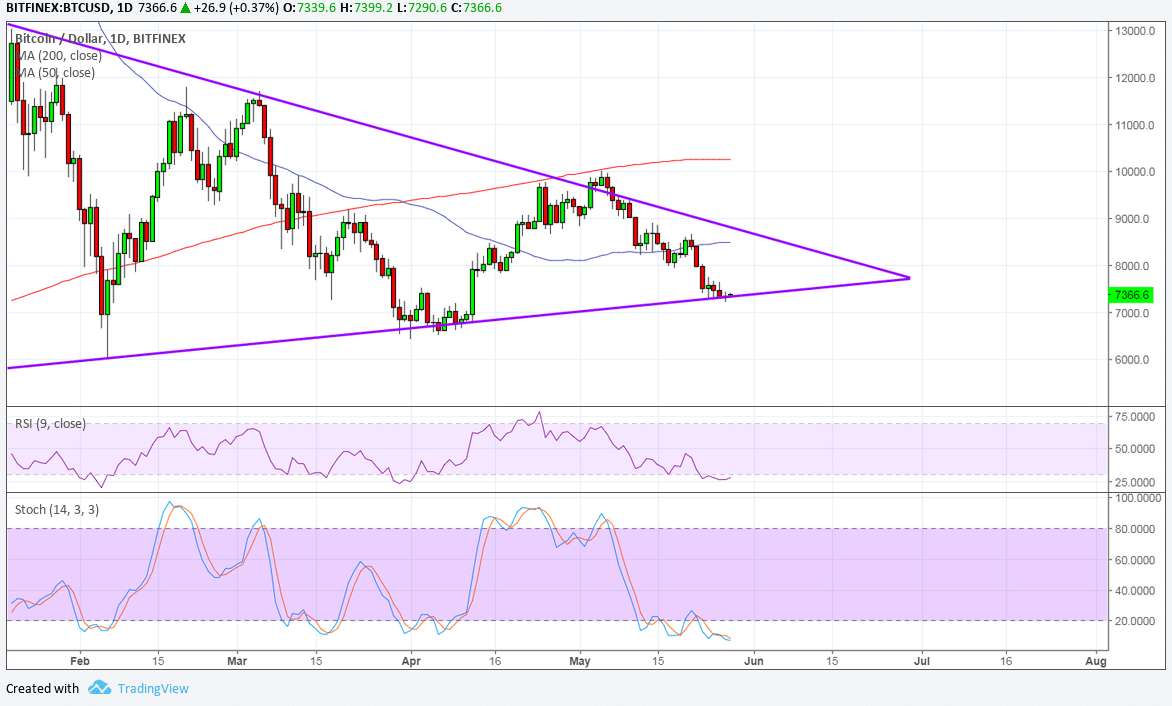
Bitcoin is down to the last line of defense for bulls but a reversal candlestick is forming.
BITCOIN PRICE ANALYSIS
Bitcoin is consolidating inside a symmetrical triangle on its daily time frame and is currently testing support. This could be the last line of defense for buyers, as a break below support could signal that a longer-term selloff is underway.
However, a reversal candlestick or a doji appears to have formed right on support, and it would need the next candle to close above the high to confirm the possible bounce. If so, bitcoin could still climb up to the top of the triangle around $8,750-9,000.
The 100 SMA is below the longer-term 200 SMA, though, so the path of least resistance is to the downside. In other words, the selloff is more likely to persist than to reverse. The gap between the moving averages is also widening to reflect stronger selling pressure.
Meanwhile, RSI is already hovering around oversold levels to reflect exhaustion among sellers. Similarly, stochastic has reached the oversold region to signal that the drop may be over. Turning higher could draw buyers back in and allow bitcoin to pull up from its drop.
There are still no positive developments being reported from the industry so far, which might keep bitcoin exposed to risk flows throughout the week. In the previous week, geopolitical risk has led to some demand for the safe-haven dollar even as the FOMC minutes signaled a slower pace of rate hikes later on.
Up ahead, the NFP report could be the main catalyst for the dollar, although market watchers will likely keep close tabs on US-China and US-North Korea talks. Further tensions could keep the lower-yielding dollar supported versus bitcoin.
Another factor that’s limiting bitcoin gains is the selling of Mt. Gox coins to pay off its creditors. This exchange held thousands of bitcoin, so it’s understandable that the liquidation of massive amounts has affected the market.
By Rachel Lee On May 28, 2018
Posted by David Ogden Entrepreneur