x






Gold prices look set to continue their recent retracement as the technical and fundamental picture worsens, according to Arslan Butt, Lead Commodities and Indices Analyst at FX Leaders.
Butt said the near-term price forecast for spot gold looks weak as the precious metal is seeing its third consecutive down day, hitting a one-week low of $2,050 per ounce during Monday’s Asian trading session.
“This decline is attributed to the robust inflation figures emanating from the United States last week, which have fueled expectations that the Federal Reserve will maintain a stance of prolonged high-interest rates,” he wrote. “Consequently, this scenario has bolstered US Treasury bond yields, providing a boost to the US Dollar (USD) and placing pressure on non-yielding gold.”
Despite this, Butt said the market is still anticipating rate cuts from the Federal Reserve as early as June.
“This expectation, combined with ongoing geopolitical tensions, is anticipated to provide a floor to gold’s value, preventing further significant losses,” he said, but cautioned that investors “are likely to remain on the sidelines, awaiting additional indicators of the Fed’s interest rate trajectory” which they hope to glean from Wednesday’s FOMC meeting.
Butt pointed out that U.S. inflation data is having a sizable impact on gold’s price dynamics, “which could adversely affect the appeal of gold.”
“Reports from the University of Michigan’s preliminary survey indicated minimal change in both one-year and five-year inflation expectations in March, while the US Consumer Sentiment Index dipped to 76.5,” he noted. “The CME Group’s FedWatch Tool suggests a 60% probability of an interest rate reduction at the June policy meeting, tempering USD bullishness.”
He said that ongoing geopolitical tensions, “particularly the continued Russia-Ukraine conflict and unrest in the Middle East,” are also expected to support the value of gold as a safe-haven asset.
“Recent escalations include intensified Ukrainian drone attacks on Russian oil facilities and Israeli Prime Minister Benjamin Netanyahu’s confirmation of plans to advance into Gaza’s Rafah region,” he said. “These developments contribute to a climate of uncertainty, bolstering the gold case.”
Turning to the technical picture, Butt noted the formation of a descending triangle breakout pattern on the 4-hour chart.
“Gold’s (XAU/USD) price dipped to $2147.07, marking a 0.36% decrease, as it teeters below its pivotal $2157.22 pivot point,” he wrote. “The asset’s breach of the descending triangle pattern close to the $2157 level highlights this movement as being bearish.”
“Immediate resistance lies ahead at $2173.06, with further obstacles at $2189.33 and $2204.58,” he added. “Conversely, support levels are identified at $2139.00, $2124.63, and $2109.75, which could act as potential rebound zones.”
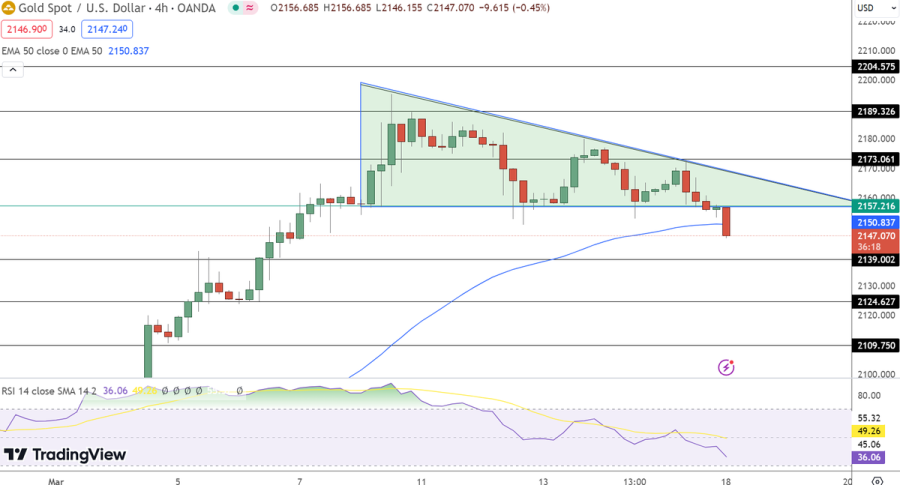
Butt said that a number of technical indicators, including a Relative Strength Index (RSI) reading of 36 and the 50-day Exponential Moving Average (EMA) positioned at $2150.84, support a bearish outlook.
“The violation of the descending triangle pattern suggests imminent selling pressures, potentially driving the price towards the $2139.00 support level,” he said.
“Overall, gold exhibits a bearish trend below the $2150 mark, with any upward movement past this threshold signalling a shift towards bullish momentum.”
Kitco Media
Ernest Hoffman