x




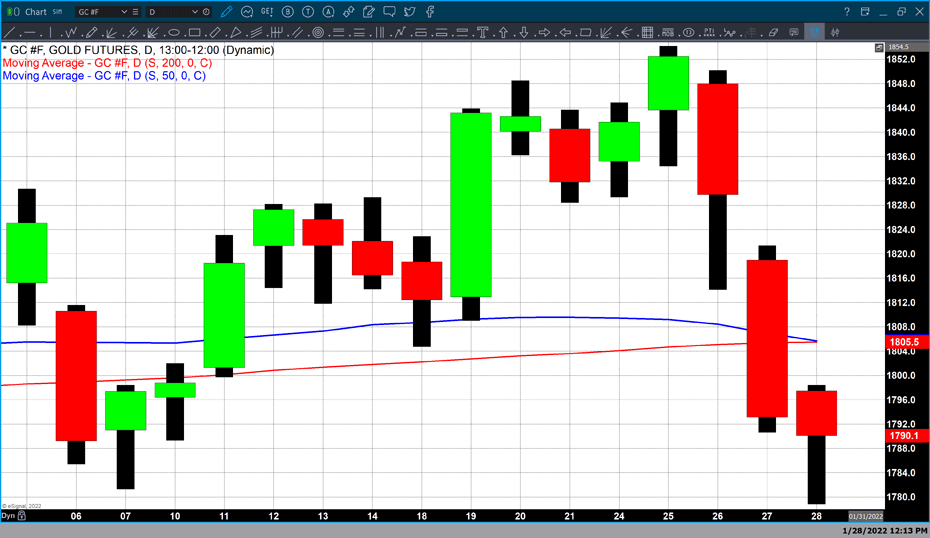
Gold has declined dramatically this week opening at approximately $1841 on Monday, with the February 2022 Comex contract currently fixed at $1790.10. Gold declined by three dollars today taking the weekly price decline two $50.90. If you factor in the highest value gold traded which occurred on Tuesday at $1854 to today's low it equals a $78 differential between the highest and lowest price gold traded to this week.
Most alarming on a technical basis it seems as though a pattern called a "death cross" is imminent. Currently, the 50-day moving average is fixed at $1805.70 and the 200-day moving average is fixed at $1805.50. In other words, the current spread between the short-term and long-term averages is $0.20.
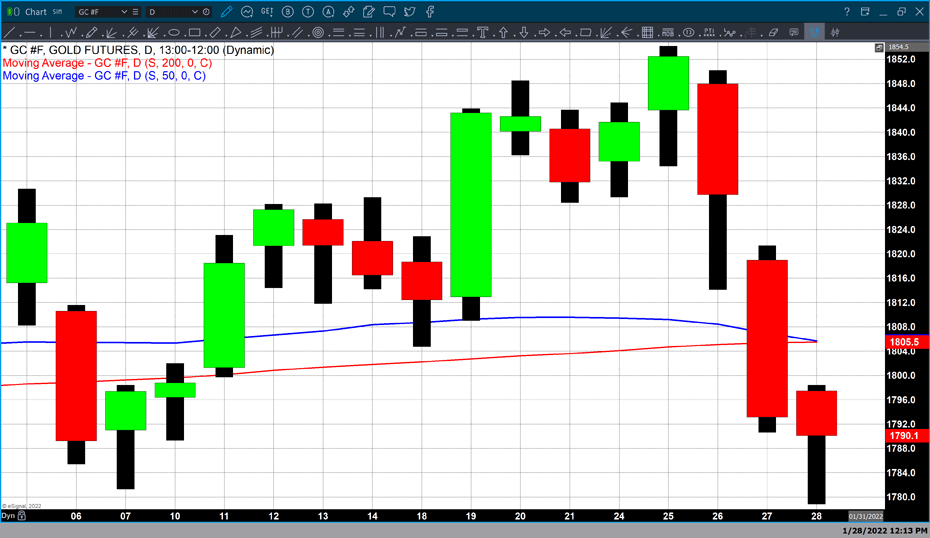
According to Investopedia, "The death cross is a technical chart pattern indicating the potential for a major sell-off. The death cross appears on a chart when a stock's short-term moving average crosses below its long-term moving average. Typically, the most common moving averages used in this pattern are the 50-day and 200-day moving averages."
However, one needs to understand that this technical chart pattern is using extremely long moving averages which intrinsically converts to major lag when compared to real-time data. There are many examples where a "death cross" is not reliable in indicating a further price decline because it is created from lagging data that was formed. After all, a major selloff has already occurred. That being said, it can be a solid indicator revealing that the selling pressure could take gold to new lows.
Nonetheless, it is something to be acutely aware of considering the fundamental events that occurred this week. First, on Wednesday the Federal Reserve's FOMC meeting concluded and confirmed what many market participants had anticipated which is that a series of interest rate hikes are forthcoming beginning in March. Yesterday's release of the fourth-quarter GDP came in exceedingly strong indicating that the annual rate of GDP increased by 6.9%. This gives the Federal Reserve the data necessary to initiate liftoff and begin a series of rate hikes throughout this year and next.
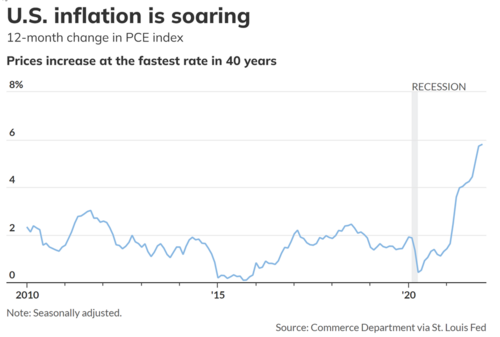
Today the Commerce Department via the St. Louis Federal Reserve released the most recent data on inflation showing that the PCE index (the preferred inflationary index used by the Federal Reserve) joined its component the CPI coming in at the fastest rate in the last 40 years. The current PCE index jumped 5.8% in 2021 after factoring in a sharp increase in December. This puts even more pressure on the Federal Reserve to raise rates quickly, with some analysts projecting that the first-rate hike could be as high as ½% to1 ½% to compensate for the current inflationary pressures.
By Gary Wagner
Contributing to kitco.com
Buy, Sell Gold and Silver, with Free Storage and Monthly Yields