

While gold has posted a pair of disappointing days this week, the technical picture still points to further price gains for the precious metal, according to OANDA Senior Market Analyst Kelvin Wong.
“The price actions of Gold (XAU/USD) have shaped the mean reversion decline after a test on the US$2,420 intermediate resistance,” Wong wrote. “It tumbled by -2.7% on Monday, 22 April, its worst daily performance since 13 June 2022 (almost two years), and continued to extend its losses in yesterday’s (23 April) Asian session.”
Wong noted that yesterday’s intraday low of $2,291 represents an accumulated loss of 5.8% from spot gold’s recent all-time high of $2,431 set on April 12.
“Now, the golden question for Gold (XAU/USD); can the bulls be revived or is it game over for its medium-term uptrend that kickstarted in mid-February 2024?” he asked.
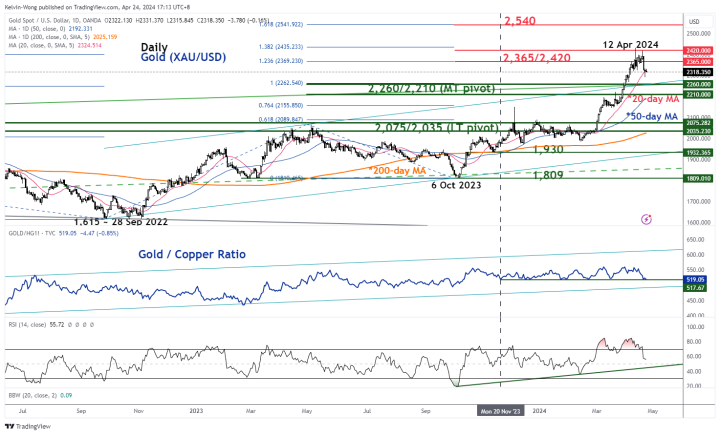
Wong highlights several technical indicators that he believes support gold’s medium-term uptrend, beginning with the gold/copper ratio, which is the spot price of gold divided by the price of high-grade copper futures in USD.
“[T]he ratio removes the US dollar exchange rate effect from the equation which in turn solely measures the relative value or outperformance or underperformance of gold against copper,” he said. “If the ratio of Gold/Copper declines steadily, it suggests that global economic growth is likely in an expansionary mode, and vice versa when the Gold/Copper ratio rises due to a relatively higher demand for gold for hedging purposes due to economic growth slowdown or uncertainties.”
Wong points out that the Gold/Copper ratio has stayed above support since late November and has remained within a major ascending channel in place since Oct. 15, 2021. “Therefore, the current configuration of the ratio suggests that there is still a relatively higher demand for gold as a hedging asset for stagflation risk.”

Another technical indicator that helps make the case for the precious metal to post further gains is the 50-day moving average (MA), which continues to support the spot gold price.
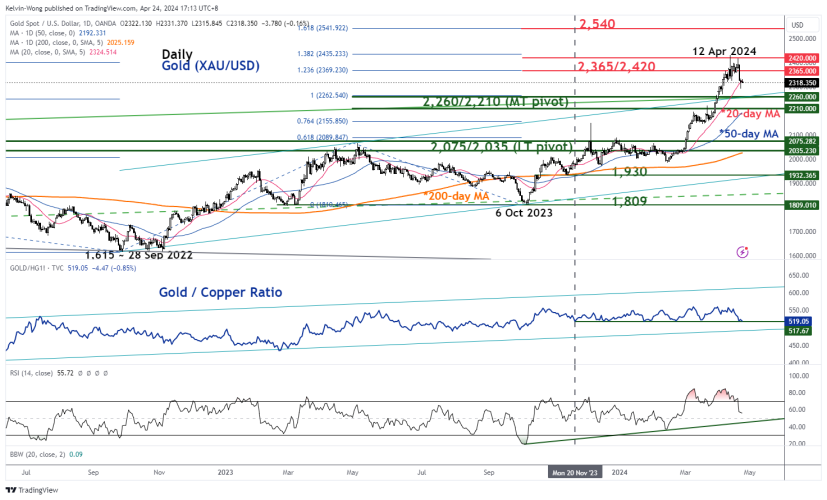
“Based on a technical analysis standpoint, the price actions of Gold (XAU/USD) are still trading above its 50-day moving average which confluences with a key medium-term pivotal support zone of US$2,260/2,210 that is defined by the former major ascending channel’s upper boundary from 28 September 2022, and the 38.2% Fibonacci retracement of the recent six-month impulsive upmove sequence from 6 October 2023 low to 12 April 2024 high,” Wong said. “In addition, the daily RSI momentum indicator is still holding above a key parallel support at around the 50 level after its exit from the overbought region which suggests that the medium-term uptrend phase from 14 February 2024 low remains intact.”
“A clearance above US$2,420 may see the next medium-term resistance coming in at US$2,540,” he added. “On the flip side, a break below the US$2,210 lower limit of the key medium-term pivotal support zone sees an extension of the ongoing corrective decline within its major uptrend phase to expose the long-term pivotal support zone of US$2,075/2,035 (also the 200-day moving average).”
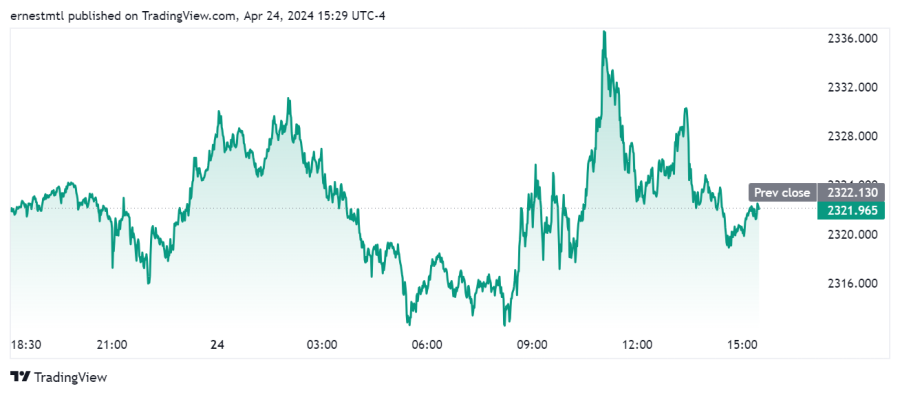
Gold’s price action has been volatile on Wednesday, with spot gold trading in a range between $2,311.81 and $2,337.38 per ounce, but it has thus far managed to keep from posting a third consecutive down day. At the time of writing, spot gold last traded at $2,322.18 per ounce, exactly flat on the session.

Kitco Media
Ernest Hoffman
