x






Bitcoin (BTC) continues to mount a recovery despite the recent bearish "death cross" chart event.
As of writing, bitcoin is changing hands at $7,400 on Bitfinex and the average price on leading exchanges, as represented by CoinDesk's Bitcoin Price Index, is seen at $7,380.
The cryptocurrency's 15-percent rally from the 54-day low of $6,425 set on April 1 is encouraging and pretty much in line with the historical relative strength index (RSI) pattern.
That said, the bulls' job is only half done, and bitcoin is still stuck in a falling channel. So, a clear break above $7,800 is now needed to confirm a bullish trend reversal and avert another sell-off.
Daily chart
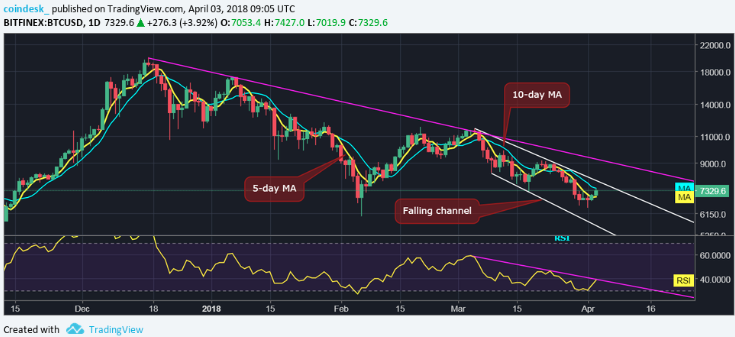
A daily close (as per UTC) above the falling channel resistance would signal a short-term bullish trend reversal - i.e. the sell-off from the March 5 high of $11,700 has ended and would allow a test of supply around the bigger descending trendline sloping downwards from the Dec. 17 high and Jan. 6 high.
Note, the falling channel resistance is lined up at $7,900 and is seen sloping downwards to $7,800 by tomorrow. A move above that level would lift the RSI above the descending trendline, thus bringing in more technical buyers into the market.
The 4-hour chart below shows scope for a rally to $7,800-$7,900 over the next 24-48 hours.
4-hour chart
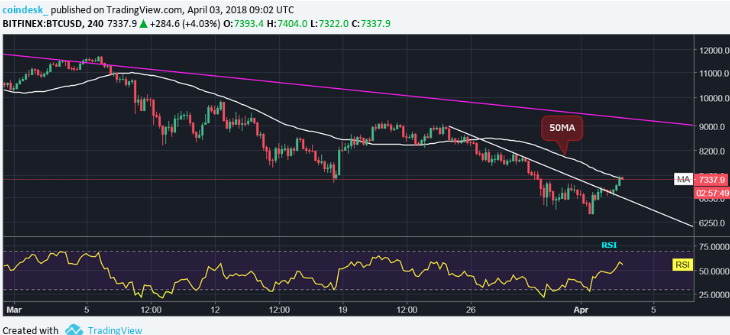
The bullish RSI divergence followed by a break above the minor descending trendline indicate that bitcoin could rally by another 400 dollars or so. The RSI is also above 50.00 (in the bullish territory) and is trending.
However, if BTC repeatedly fails to take out the falling channel hurdle (seen in the daily chart) in the next couple of days, then the bears may flex their muscle. Moreover, that would mean the recent gains are nothing more than a corrective rally. The ensuing sell-off could take BTC down to $6,000 (November lows).
As a result, the falling channel resistance presents a sort of acid test for the bitcoin market.
In the larger scheme of things, a bullish reversal is seen only above $11,700 as shown by the long duration chart below.
Weekly chart
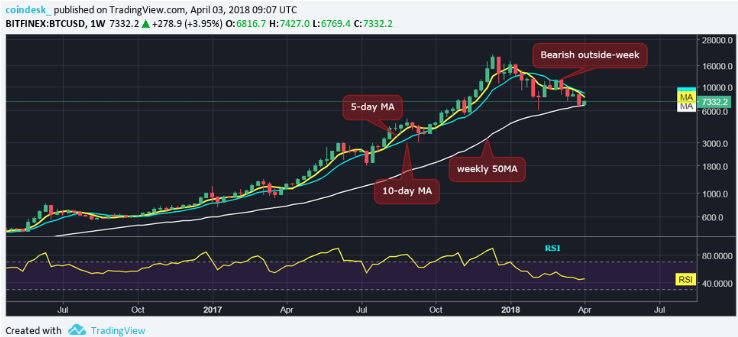
BTC has defended the 50-week moving average (MA), yet the outlook remains bearish as suggested by the descending 5-week MA and 10-week MA. Furthermore, the RSI is bearish. Only a move above $11,700 (bearish outside-week candle high) would revive the bullish outlook and potentially yield rally to fresh record highs.
View
BTC could test the falling channel resistance in the next 24-48 hours (currently seen at $7,900, will be at $7,800 tomorrow).
A daily close above the channel resistance would signal short-term bull reversal and expose resistance lined up at $8,090 (5-week MA) and $9,177 (March 21 high).
Repeated failure to beat the channel hurdle could yield a re-test of $6,425 (April 1 low).
Author: Omkar Godbole Updated Apr 3, 2018 at 22:07 UTC
Disclaimer: This article is not intended to provide investment advice.
Posted by David Ogden Entrepreneur