x





Bitcoin is approaching an end to a trading pattern, that potentially spans back over 5 months with a $10000 range.
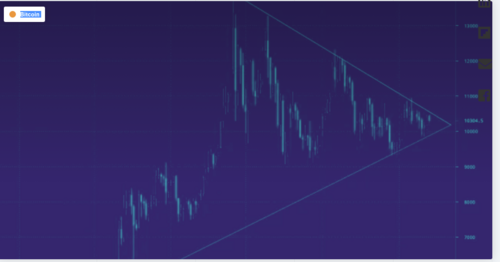
Bitcoin is sitting inside a mammoth 5-month trading pattern—with a possible breakout approaching in the next 10 days. The pattern is called a symmetrical triangle, and refers to a chart characterized by two converging trend lines connecting a series of sequential peaks and troughs.
Looking back over the last 160 days, bitcoin's price sat neatly inside this pattern–the first signs of it emerged in May this year, when bitcoin's price rallied from a low of $5,000.
From there, bitcoin gained steadily over the next two months, to hit a high of nearly $14,000 in June. That was followed by three distinct lower highs of $13000, $12000 and $11000, in July, August and September, as the chart below shows.
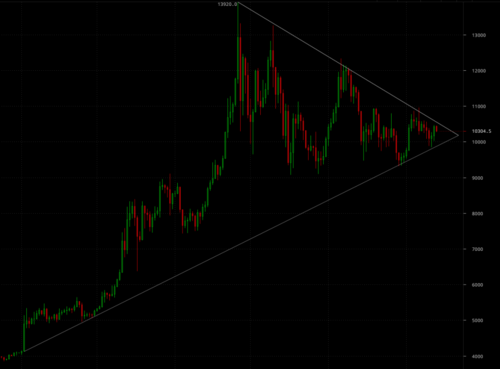
Bitcoin has been fitly into this triangle pattern, but for how much longer?
On the support (lower) side of the triangle—bitcoin saw two recent higher lows of $9350 and $9850, in late August and just 2 days ago on September 11.
More interesting than just the pattern, however, is the shape's length, and range in the price's movement—5 months and an astonishing $10,000 (from top to bottom). While it's impossible to predict what will happen next, when a break out does occur—i.e. a price drop or rise that falls outside the trend lines—it's like to be sizable. A movement as high as a $5,000 swing up, or down, over the next few weeks is not beyond expectations.
For now, all eyes seem to be on the expiry of this pattern—with many predicting that it will be on the exact day of the Bakkt bitcoin futures launch, coming up in just 10 days.
By Nawaz Sulemanji
September 13, 2019