
Editor's Note: With so much market volatility, stay on top of daily news! Get caught up in minutes with our speedy summary of today's must-read news and expert opinions. Sign up here!

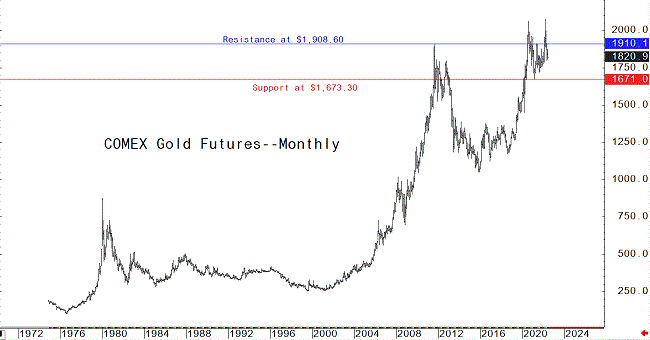
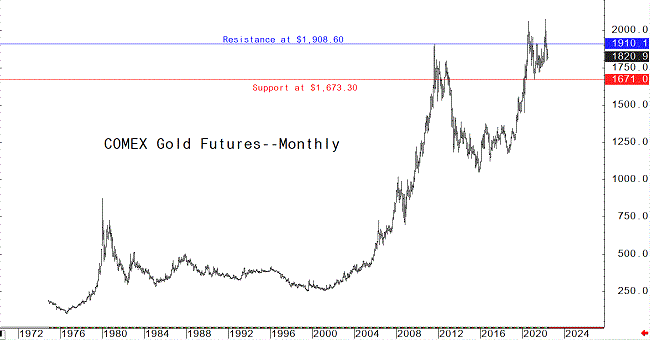
(Kitco News) - An examination of the monthly continuation chart for nearby Comex gold futures is a classic example of why it’s important to look at the longer-term charts, in order to gain a critical over-the-horizon perspective on where a market has been and where it may be heading.
The monthly gold chart shows prices are still not far below the record high of $2,078.80, basis nearby futures, scored in March of this year. Prices have pulled back from the record high, but not a lot, by longer-term historical standards. Technical analysts call this price action a “downside correction” in an overall longer-term price uptrend that remains in place. Gold market bulls still have the firm longer-term technical advantage.
By Jim Wyckoff
For Kitco News
Time to buy Gold and Silver on the dips
