x





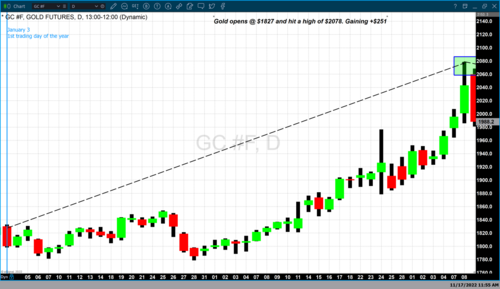
This has been a most interesting year for investors and traders who have been active in gold. There have been two completed trends that contained both a multi-month rally and a multi-month correction. During the first week of January gold was already in rally mode, and opened at $1827 on the first day of trading, January 3. By March 8, gold had traded to its highest value this year at $2078 per ounce. The result was a rally in which gold gained approximately $251.
What followed was an extended multi-month correction from March 8th until the last week of September when gold traded to a low of approximately $1620. Gold would test this level on three occasions from September up until the first week of November. During this correction, gold would trade through a series of multiple lower highs and lower lows giving technical confirmation that gold was fully immersed in a bearish scenario.
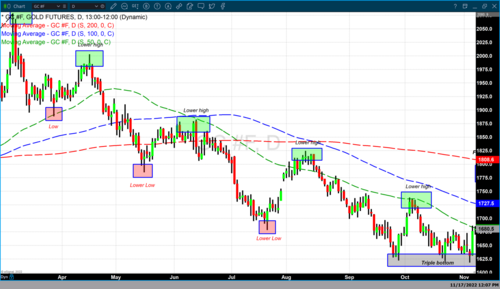
Another indication was the positioning of three moving averages which moved into full bearish alignment (chart 2 above) which continues to this day. Full bearish alignment using three moving averages results in the longest average (200-day) having the highest value, followed by the 100-day moving average below it, and the 50-day moving average below that. Currently, the 200-day moving average is $1808.60. The 100-day moving average is $1727.50, and the 50-day moving average is $1681.
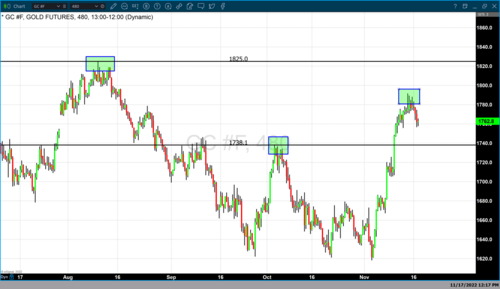
Chart 3 is a four-hour Japanese candlestick chart of gold futures highlighting the last three highs. After gold hit its highest value this year in March gold prices declined and could be characterized by four consecutive lower highs. However, as you can see on the chart above the first two lower highs occurred in the middle of August when gold hit a high of $1825. That was followed by a lower high at $1738 during the first part of October.
Gold hit approximately $1620 for the third time at the beginning of November which marked the end of the multi-month correction and the beginning of a rally. Yesterday gold hit a high of $1782 and in the last 24 hours has moved to lower pricing. As of 5:16 PM, EST gold futures are currently fixed at $1762.80 after factoring in today’s decline of $13 or 0.73%. This indicates the possibility that yesterday’s high marks the end of this leg of the current rally and could be followed by a correction taking gold to lower pricing. If the current correction results in a higher low than the last low we would get confirmation that the multi-month correction has indeed concluded.
The decline that occurred in gold over the last 24 hours is based upon recent comments by members of the US Federal Reserve in which they signaled that they would not abandon their current hawkish monetary policy to continue to reduce inflation to an acceptable level. The core PCE is still at approximately 6% which is three times the Federal Reserve’s target level of 2%.
While the amount of each rate hike could be reduced, their endgame is still to take inflation close to their target level. Therefore, while we could see interest rate hikes of 50-basis points rather than 75-basis points the Fed today signaled they would continue to raise rates until their objective of lowering inflation is met.
By Gary Wagner
Contributing to kitco.com