
x
Black Bar Banner 1
x

Alert!  New Secured Wallets are installed! new Blog system with AI  power and auto blog curation coming soon  Alert! 

Ads by Markethive - View All
Blogs
The Blog Feed
Write a New Blog Post
Search Blog Status
Most Viewed
Most Recent
Most Shared
Alphabetical
Blog Main Menu
Markethive Blog (default)
All Blogs
My Blog Posts
Friends' Blogs
Blog Categories
All
Advertising
Blockchain & Cryptocurrency
Business Development
Diet & Weight Loss
Environmental
Health and Wellness
History and Culture
Home and Garden
Marketing
Mentoring & Training
Money & Finance
Other
Political
Prayer & Religion
Programming & Technical
Real Estate
Search Engine Optimization
Social Media
Spirituality
Sports & Recreation
Transport
Travel & Events
Website Design
Blogging Tools & Assets
My Blog Info
Members Subscribed to You
Blogs You Are Subscribed To
Website Widget
Wordpress Plugin

Bitcoin - Cup and saucer breakout on the horizon?

Posted by David Ogden on March 01, 2019 - 10:46pm


Bitcoin - Cup and saucer breakout on the horizon?

Bitcoin - Cup and saucer breakout on the horizon?

  • BTC in the process of handle formation of the pattern.

  • Bullish once handle consolidation completes, breakout likely soon.

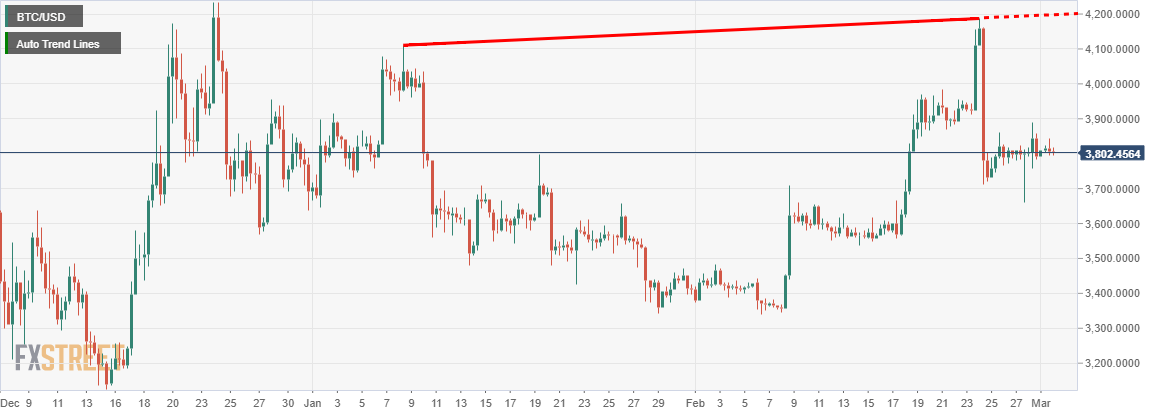
Bitcoin, the largest cryptocyrrency by market capitalisation, after running up and breaking past the psychologically important $4,000 mark, gave up those gains and is now in the consolidation phase of the cup and saucer technical pattern, which is bullish for the poster boy.


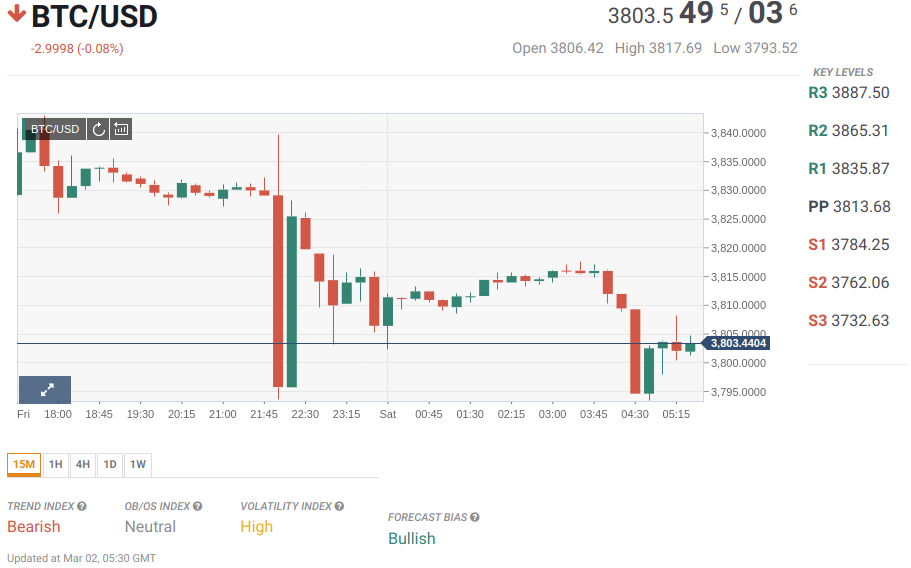
BTC/USD is down two cents of a percent at $3,800 and trading in less than one percent range for the day so far. On the 480-minute chart of this largest coin, it has formed a cup and saucer technical pattern which is a bullish sign, once the consolidation phase is complete.


Consolidation phase is the formation of handle, which is final phase of this pattern, after completion of which, the crypto should head upwards and the breakout point would be recent high, $4,187 that is. Target after the breakout would be around $5,100 - exactly around the 200 days SMA and EMA.


BTC/USD 480-minute chart:
 

| 33 minutes ago

Manoj B Rawal Manoj B Rawal

FXStreet