x




Bitcoin breaks key levels again after breaching $4k.
Long term bottom is not in place yet.
Bitcoin, the poster boy of cryptocurrencies, has broken down of some key levels after breaking below $4,000 and is now at the risk of breaching $3,000 too as long term bottom is not yet in place for the largest crypto.
BTC/USD trading flat on day at $3,633 and in less than one percent range for the day - typical low volume and even lower volatility weekend trading that is. Earlier this week, Bitcoin and all the other major coins saw massive sell-off all over again, resulting in BTC breaking $4,000 again and as a result also broke some key levels on the short term (180-minute) as well as long term (daily) chart.
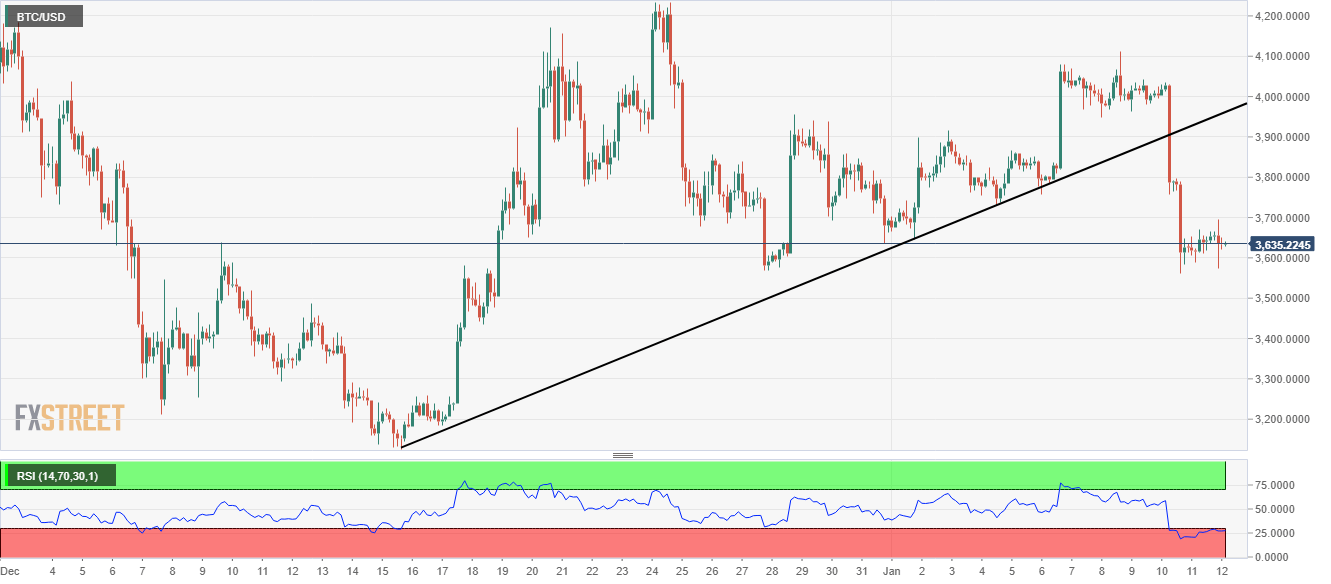
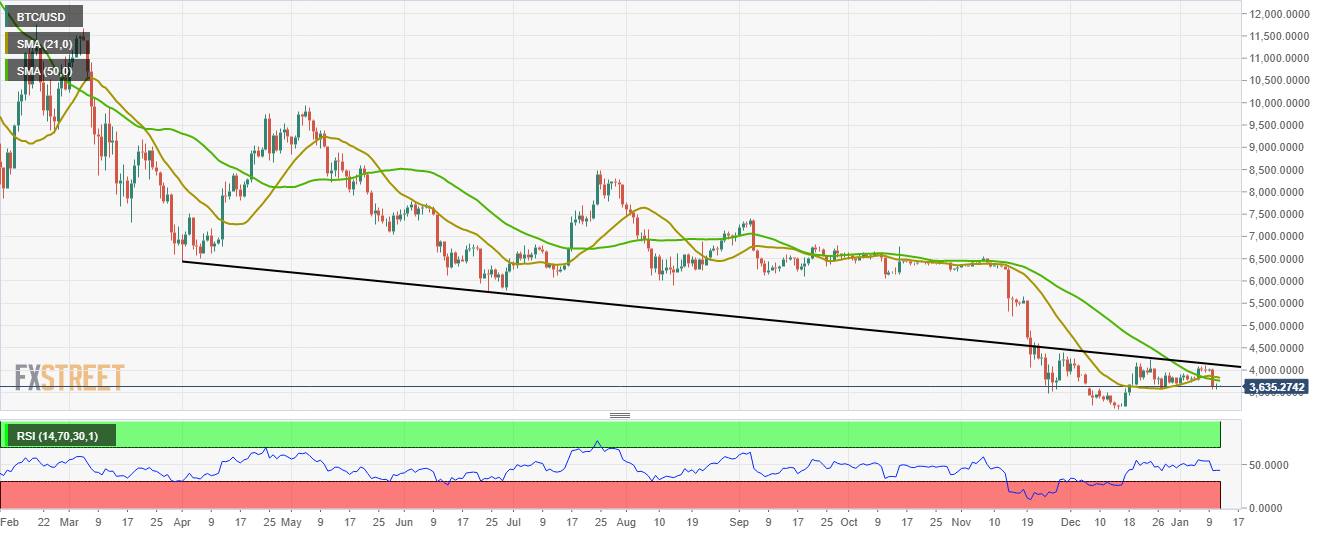
On the 180-minute chart, BTC broke off a key ascending trendline support that was forming after it made a temporary bottom around $3,100 and bounced quite a bit. In this bounce it did attempt to break past the descending trendline resistance on the daily chart - once in late Novemeber, then again around Christmas and last attempt on Tuesday this week. Failing all the time and finally bears got control of the battleground. There is every chance that bulls' resolve to hold on to November lows and $3,000 would be ferociously tested in the coming days.
BTC/USD 180-minute chart:
BTC/USD daily chart:
Manoj B Rawal
FXStreet