x




Bitcoin Price Key Highlights
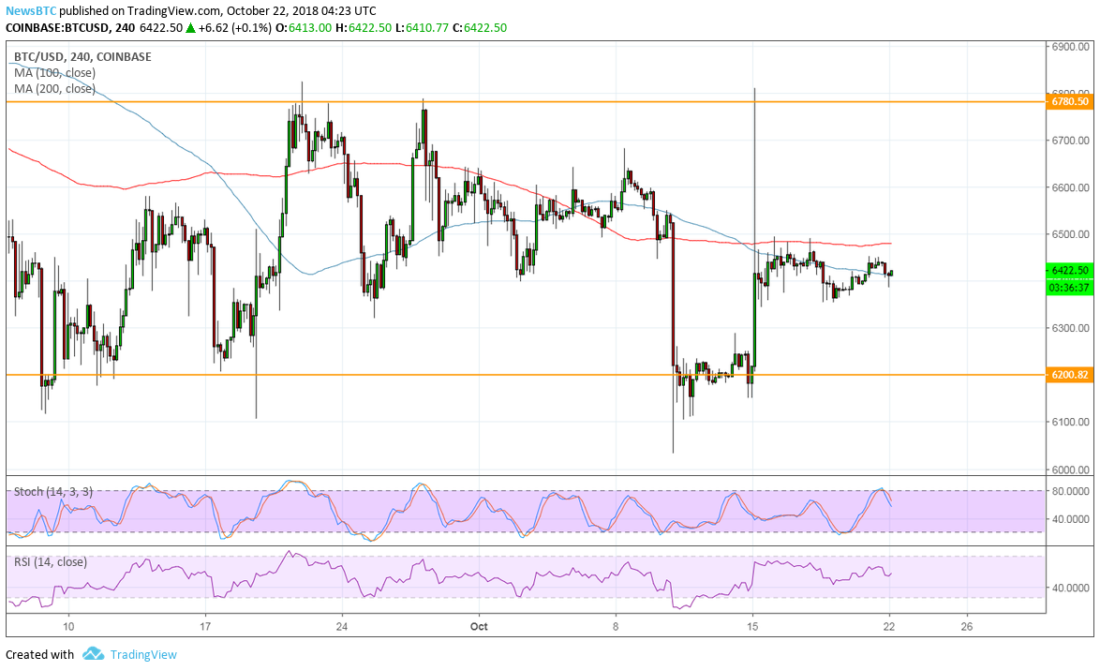
Bitcoin price is still treading sideways, right in the middle of its range visible on the 1-hour and 4-hour charts.
Price has yet to break out of the current consolidation to show whether it would make a test of support or resistance.
Technical indicators seem to be suggesting that a move towards the bottom of the range is due.
Bitcoin price still seems to be waiting for directional clues as it moves sideways in the middle of a $600-sized range.
Technical Indicators Signals
The 100 SMA is below the longer-term 200 SMA to signal that the path of least resistance is to the downside. In other words, a move lower is more likely to happen than a break higher. The moving averages also appear to be holding as dynamic resistance levels as well.
Stochastic is turning lower after recently hitting overbought levels, also suggesting a return in selling pressure. This might be enough to take bitcoin price to the bottom of its range at $6,200. RSI is already on the move down to confirm that sellers have the upper hand.
If buyers are able to step in, a move to the range top at $6,800 could be seen. A break above this could lead to a rally of the same height as the rectangle while a drop below support could lead to a selloff of the same size as well.
There are a handful of positive developments in the bitcoin industry these days, but it looks like traders are waiting for bigger announcements or might be feeling anxious while the SEC continues to mull its decision on the ETFs.
The launch of Fidelity’s institutional platform is big news as this would usher in big flows from funds, banks, and financial institutions. This would boost volumes, activity, and demand, thereby shoring up prices.
SARAH JENN | OCTOBER 22, 2018 | 4:43 AM