x





BTC/USD Medium-term Trend: Bearish
Resistance Levels: $6,800, $6,900, $7,000
Support levels: $3,300, $3,200, $3,100
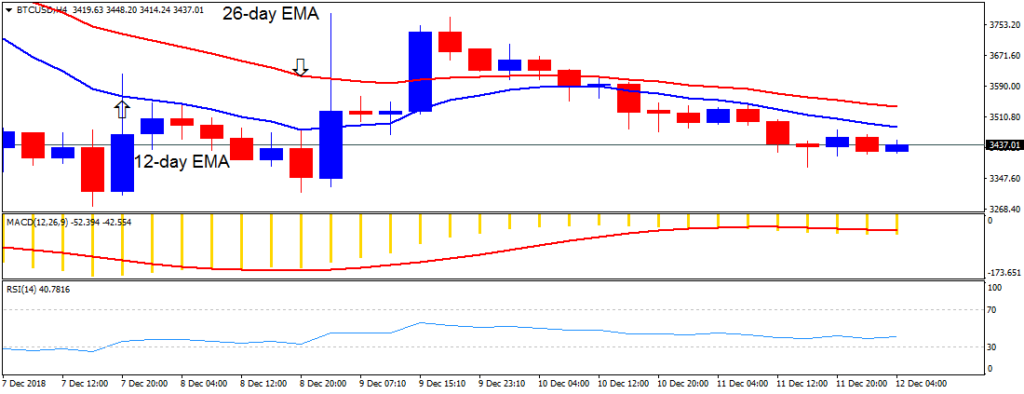
Yesterday, December 11, the price of Bitcoin was in a bearish trend. In the last 48 hours, the price of Bitcoin had been in the bearish trend zone. The crypto's price had been fluctuating above the $3,400 price level. It was suggested that if the bears broke the $3,400 price level, the crypto will resume the downtrend and price is expected to test the $3,000 price level.
Today, the crypto's price is below the EMAs and price is fluctuating above the $3,400 price level. Meanwhile, the MACD line and the signal line are below the zero line which indicates a sell signal. Also, the BTC price is below the 12-day EMA and the 26-day EMA which indicates that price is likely to fall.
BTC/USD Short-term Trend: Bearish
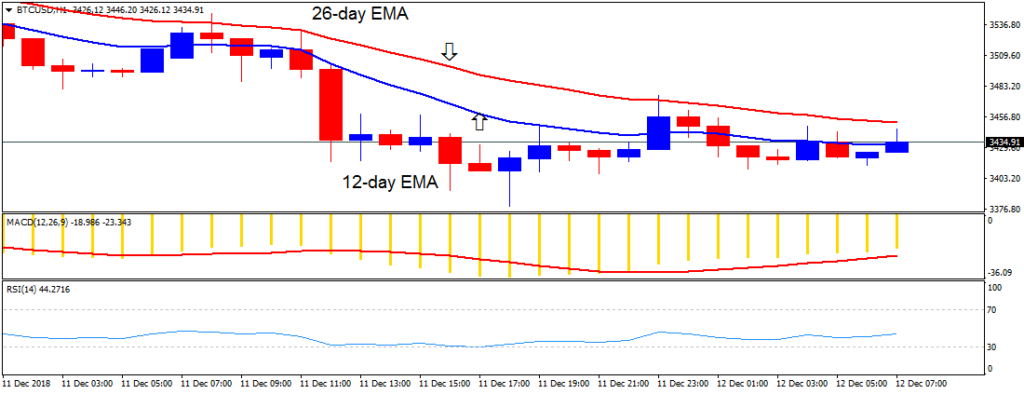
On the 1-hour chart, the price of Bitcoin is in a bearish trend. In the bearish trend of yesterday, the crypto’s price fell to the low of $3,413.3 and commenced a bullish movement on the upside. The bulls broke the 12-day EMA but were resisted by the 26-day EMA and price fell back to the bearish trend zone.
Meanwhile, the price of Bitcoin is below the 12-day EMA and the 26-day EMA which indicates that price is likely to fall. The Relative Strength Index period 14 is level 37 which indicates that price is nearing the oversold region.
By Azeez M - December 12, 2018