x





 c
c
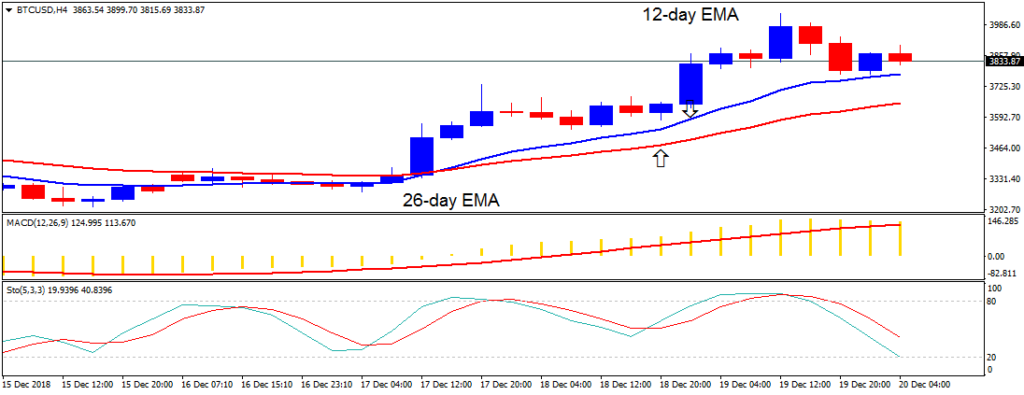
BTC/USD Medium-term Trend: Bullish
Resistance Levels: $6,800, $6,900, $7,000
Support levels: $3,700, $3,600, $3,500
Yesterday, December 19, the price of Bitcoin was in a bullish trend. The price of Bitcoin is above the 12-day EMA and the 26-day EMA indicating that price is likely to rise. The crypto’s price reached the high of $3,950 but was resisted at the $4,000 price level.
The BTC price is now retracing from the recent high. If price retraces, it may retrace to the moving averages and resume its uptrend. However, if price retraces and breaks 12-day EMA and the 26-day EMA, the price of Bitcoin will resume its downward trend. Meanwhile, the Stochastic is in the range below the 40% range. This implies that the price of Bitcoin has a bearish momentum
BTC/USD Short-term Trend: Ranging
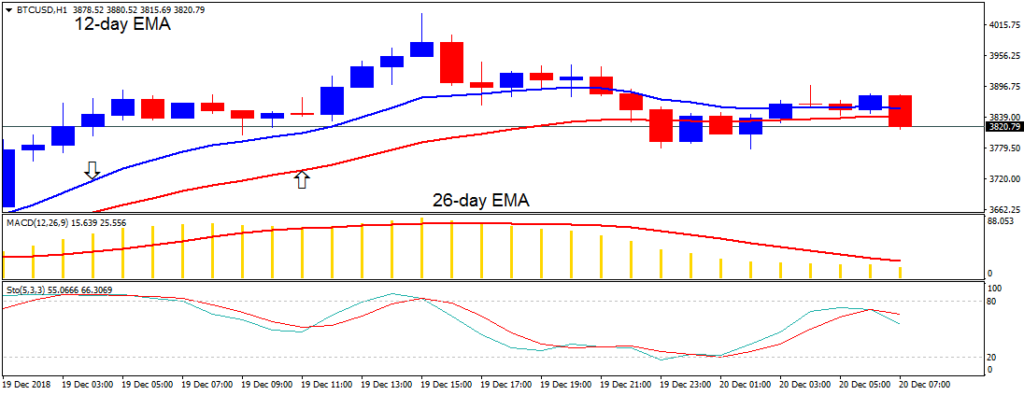
On the 1-hour chart, the price of Bitcoin was in a bearish trend. The price of Bitcoin is now below the 12-day EMA and the 26-day EMA which indicates that price is in the bearish trend zone. The MACD line and the signal line are below the zero line which indicates a sell signal. Also, the stochastic indicator is in the range below the 80% range. That is, the BTC price has a bearish momentum and a sell signal.
By Azeez M - December 20, 2018