

x
Black Bar Banner 1
x

Alert!  New Secured Wallets are installed! new Blog system with AI  power and auto blog curation coming soon  Alert! 

Ads by Markethive - View All
Blogs
The Blog Feed
Write a New Blog Post
Search Blog Status
Most Viewed
Most Recent
Most Shared
Alphabetical
Blog Main Menu
Markethive Blog (default)
All Blogs
My Blog Posts
Friends' Blogs
Blog Categories
All
Advertising
Blockchain & Cryptocurrency
Business Development
Diet & Weight Loss
Environmental
Health and Wellness
History and Culture
Home and Garden
Marketing
Mentoring & Training
Money & Finance
Other
Political
Prayer & Religion
Programming & Technical
Real Estate
Search Engine Optimization
Social Media
Spirituality
Sports & Recreation
Transport
Travel & Events
Website Design
Blogging Tools & Assets
My Blog Info
Members Subscribed to You
Blogs You Are Subscribed To
Website Widget
Wordpress Plugin

Bitcoin (BTC) Daily Price Forecast – November 14

Posted by David Ogden on November 13, 2018 - 11:19pm


Bitcoin (BTC) Daily Price Forecast – November 14

Bitcoin (BTC) Daily Price Forecast – November 14

  • BTC/USD Medium-term Trend: Ranging
  • Resistance Levels: $6,800, $6,900, $7,000
  • Support levels: $6,300, $6,100, $5,900

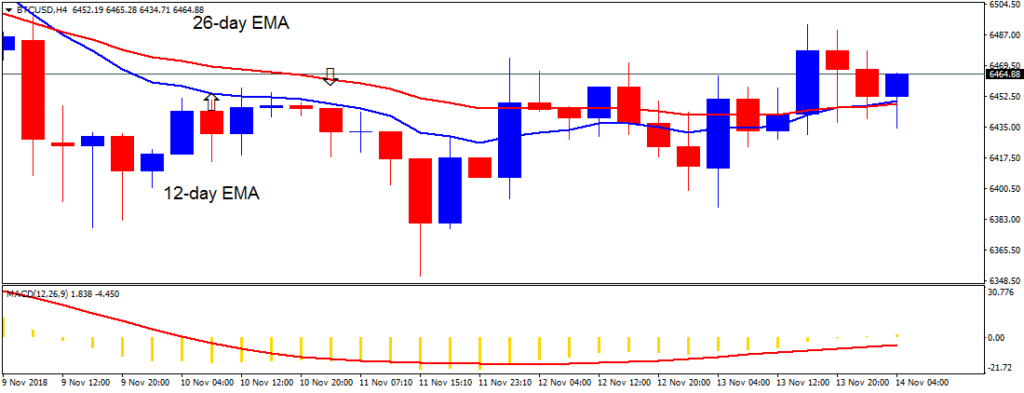
Yesterday, November 13, the price of Bitcoin was in a sideways trend. The crypto’s price had been in a sideways trend before price broke that level to the low of $6,300 on November 11. On November 13, the crypto’s price has resumed its sideways trend. Price of Bitcoin is now fluctuating above the $6,400 price level.

The 12-day EMA and the 26-day EMA are horizontally flat indicating the sideways trend. The small body’s candlesticks are indecisive candlesticks describing the indecision of buyers and sellers at the $6,400 price level. There will be no trade recommendation as the price of Bitcoin is still in a sideways trend. Meanwhile, the crypto’s price is above the 12-day EMA and the 26-day EMA indicating that price is likely to rise. The MACD line and the signal line are above the zero line which indicates a buy signal.
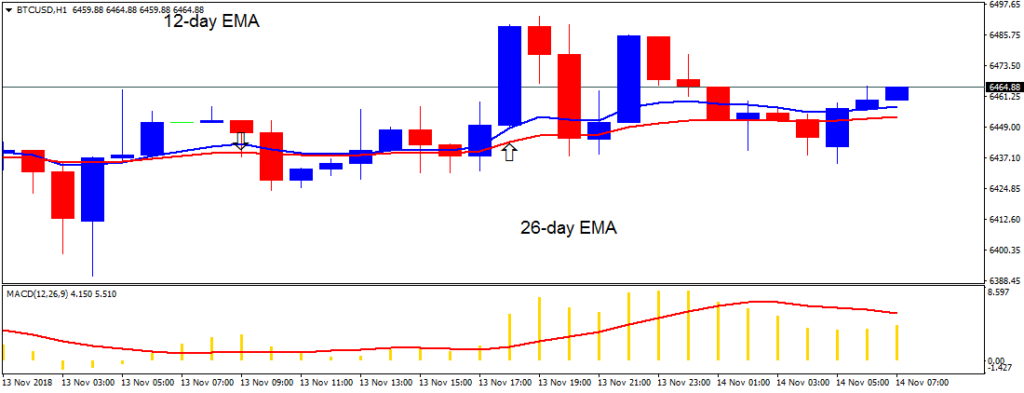
On the 1-hour chart, the price of Bitcoin is in a sideways trend. The price bars are fluctuating above the exponential moving averages. The MACD line and the signal line are above the zero line which indicates a buy signal.


By Azeez M - November 14, 2018