x





BTC/USD Medium-term Trend: Bearish
Resistance Levels: $6,800, $7,000, $7,200
Support levels: $6,200, $6,000, $5,900
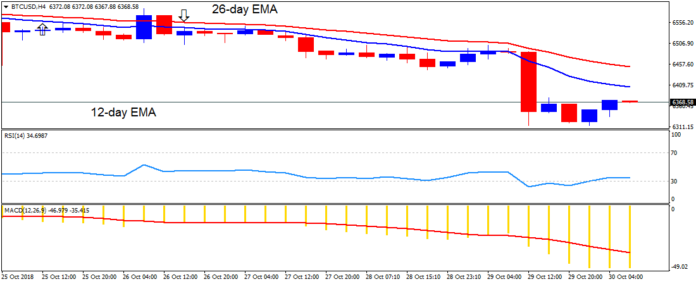
Yesterday, October 29, the price of Bitcoin was in a bearish trend. The digital currency had been range bound above the $6,500 price level in the last three weeks. The cryptocurrency fell to the low of $6,300 and commenced a range bound movement. Previously, the BTC price was range bound between the levels of $6,200 and $6,600.
The crypto's price is likely to revisit the previous low of $ 6,200. This was the lower price range which is likely to be tested. If the price falls again and holds at the $6,200 price level traders should initiate long trades. Then stop-loss orders should be placed below the $6,200 price level. Meanwhile, the MACD line and the signal line are below the zero line which indicates a sell signal. The price of Bitcoin is below the 12-day EMA and the 26-day EMA which indicates that price is in a bearish trend zone.
BTC/USD Short-term Trend: Bearish
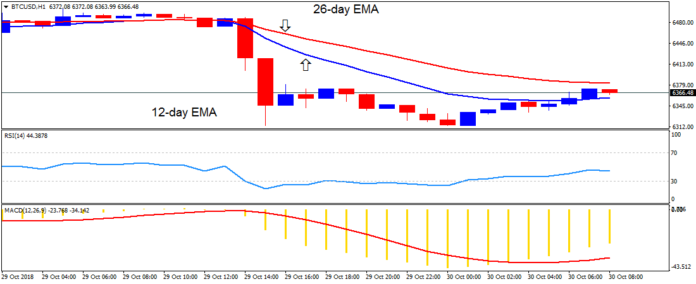
On the 1-hour chart, the BTC price is in a bearish trend. The digital currency is below the 12-day EMA and the 26-day EMA which indicates that price is falling. Meanwhile, the MACD line and the signal line are below the zero line which indicates a sell signal.
The views and opinions expressed here do not reflect that of BitcoinExchangeGuide.com and do not constitute financial advice. Always do your own research.
By Azeez M - October 30, 2018