x



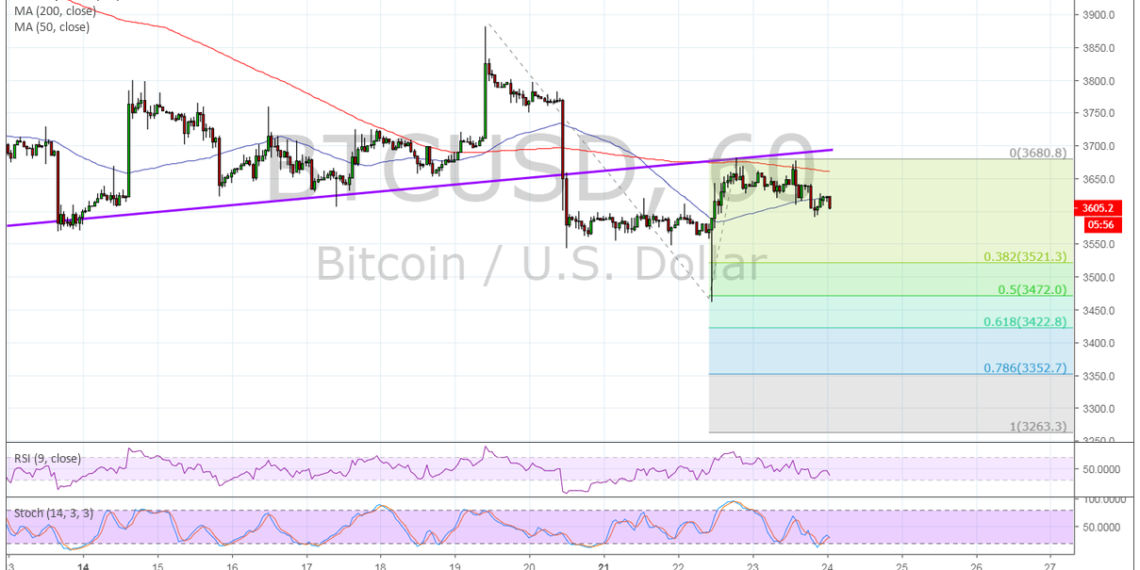
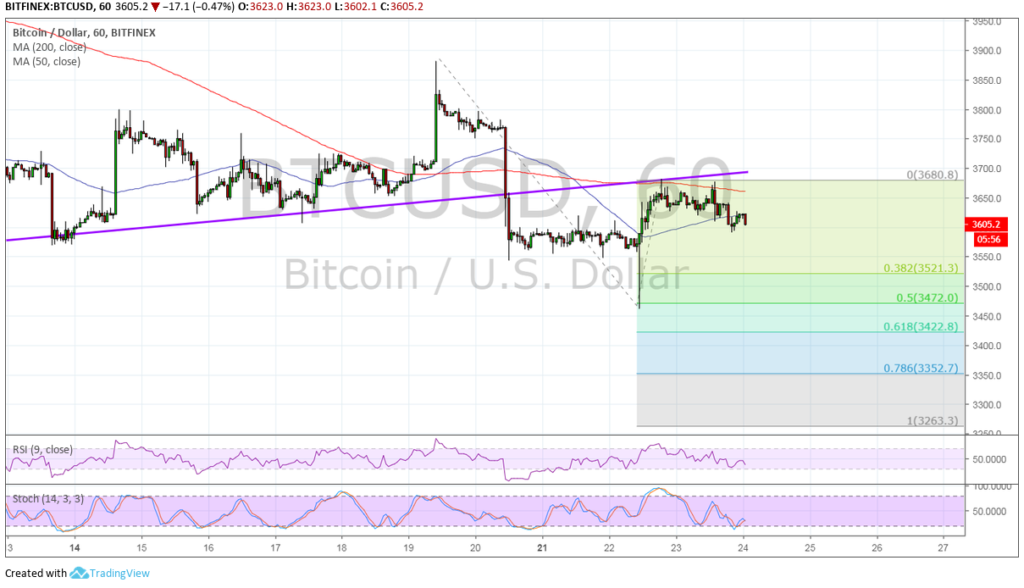
Bitcoin recently broke below a short-term rising trend line to signal that bearish pressure was very much in play. Price bounced off support around the $3,500 area but this seems to be a mere pullback from the breakdown.
Bitcoin hit resistance at the broken trend line, and the Fib extension tool shows the next potential downside targets. The 50% extension lines up with the swing low, which might be the first take-profit point for sellers.
Stronger selling pressure could take it down to the 61.8% extension at $3,422.80 or the 78.6% extension at $3,352.70. The full extension is located at $3,263.30
The 100 SMA is below the longer-term 200 SMA to indicate that the path of least resistance is to the downside. In other words, the selloff is more likely to resume than to reverse. Price is also treading below both moving averages, which means that these indicators could serve as dynamic inflection points from here. However, the gap between the moving averages is narrowing to indicate weakening selling momentum and a potential bullish crossover.
RSI is still heading south so bitcoin might follow suit. The oscillator has some room to go before hitting the oversold area, which suggests that selling pressure could stay in play for a bit longer. Stochastic already seems to have climbed out of the oversold region to hint that bullish momentum is about to return.
Rachel Lee by Rachel Lee January 24, 2019