x




Bitcoin has spiked around current support levels as bulls and bears battle it out.
Bitcoin underwent a pickup in volatility, leading to spikes in both directions, but ultimately holding its head above the falling wedge support. Technical indicators are giving mixed signals, so it’s still tough to tell which direction the next move might go.
The 100 SMA just recently crossed below the longer-term 200 SMA to signal that the path of least resistance is to the downside. In other words, support is more likely to break than to hold. In that case, bitcoin could fall by the same height as the chart pattern. Price is also below the moving averages dynamic inflection points, which could keep holding as resistance.
RSI is on the move up, though, so there may be some buying pressure left in play. Heading further up until it reaches overbought levels could take bitcoin price along with it. Similarly stochastic has room to head higher before hitting overbought territory, so buyers could have some energy to push for more gains.
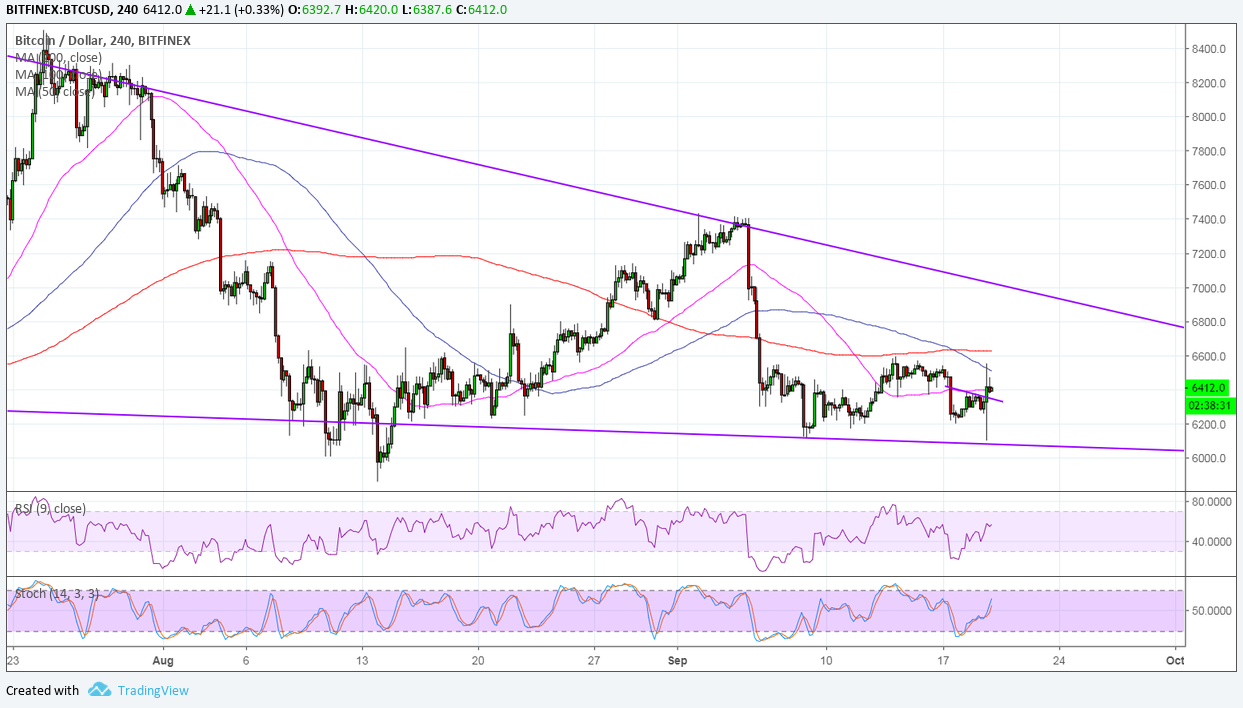
Price also looks ready to complete a double bottom formation on the latest bounce, with the neckline located around $6,600. A break past this resistance could spur a rally that’s the same height as the chart formation. Stronger bullish pressure could even lead to a test of the wedge resistance at $7,000 or a break higher, which might then be followed by a rally that’s the same height as the chart pattern.
Analysts point to the buildup of sell orders leading up to the SEC decision on bitcoin ETF applications. Recall that the regulator already rejected a handful then announced a decision to review those proposals. Soon after, the SEC decided to temporarily suspend a couple of crypto-based instruments, citing “confusion” on the nature of underlying markets and reiterating their mandate to protect consumers.
Still, bulls strongly defended support yet again as many have been waiting to buy on dips.
By Rachel Lee On Sep 20, 2018