x




Bitcoin is heading further north and is approaching the next major area of interest.
BITCOIN PRICE ANALYSIS
Bitcoin appears to be starting a climb on its short-term time frames but has yet to break past this major area of interest to sustain the uptrend. On the 4-hour chart, technical indicators are suggesting that there’s a chance for the downtrend to resume.
For one, the 100 SMA is safely below the longer-term 200 SMA to signal that the path of least resistance is to the downside. This means that the selloff is more likely to carry on than to reverse.
Stochastic is turning lower after hitting overbought levels, which means that selling pressure is returning while buyers take a break. Similarly RSI is heading south so bitcoin could follow suit and revisit the swing low around $5,750.
Price has broken past the 100 SMA near-term dynamic resistance to show a bit of bullish momentum but has yet to contend with the 200 SMA dynamic inflection point. This lines up with the 50% Fibonacci retracement level around $6,750. A break higher could still hit a ceiling at the 61.8% level near the $7,000 major psychological resistance.
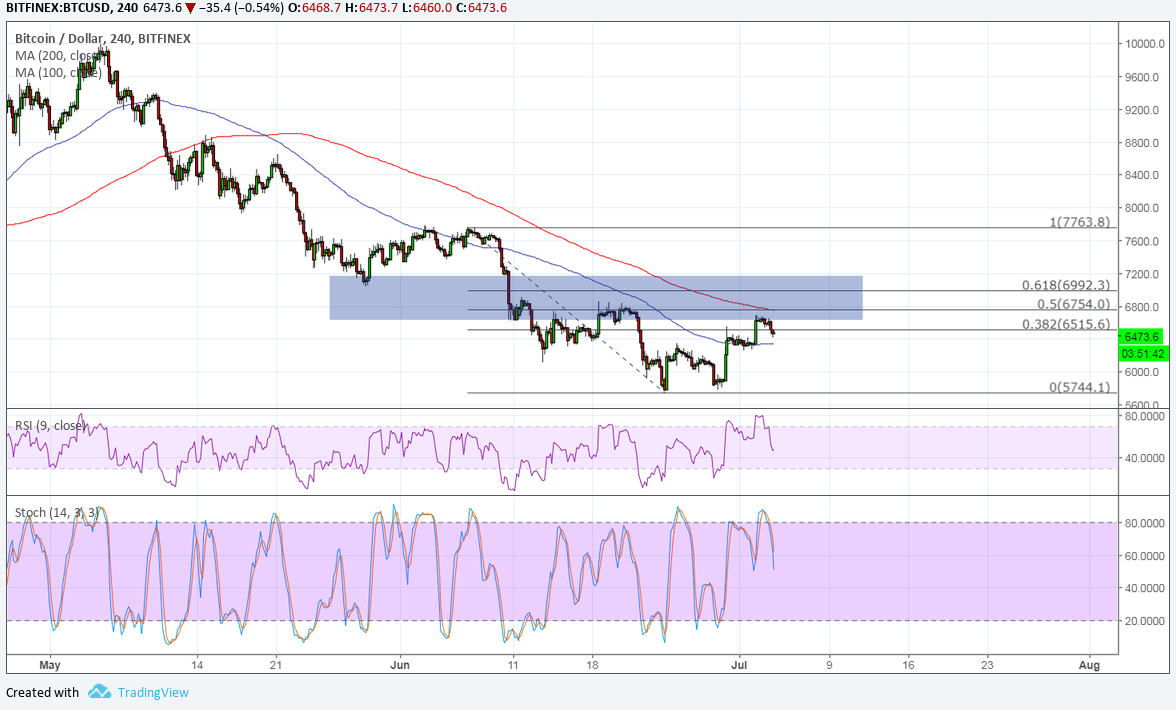
A break past these levels could finally signal that bulls have won over and reflect a longer-term reversal from the drop that lasted roughly a couple of months. On the other hand, if any of the nearby resistance levels keep gains in check, bitcoin might even break below the swing low later on.
So far, though, cryptocurrencies have been reestablishing a more solid footing at the start of this quarter. Some attribute it to investor optimism which is usually observed during the start of new months while others say that this is merely a dead cat bounce.
Another factor that may be propping up bitcoin and its peers is the ongoing trade war, as escalation could bring more losses to stocks and commodities. Investors seeking higher returns on riskier holdings could choose to put their funds in digital assets instead.
By Rachel Lee On Jul 4, 2018