x




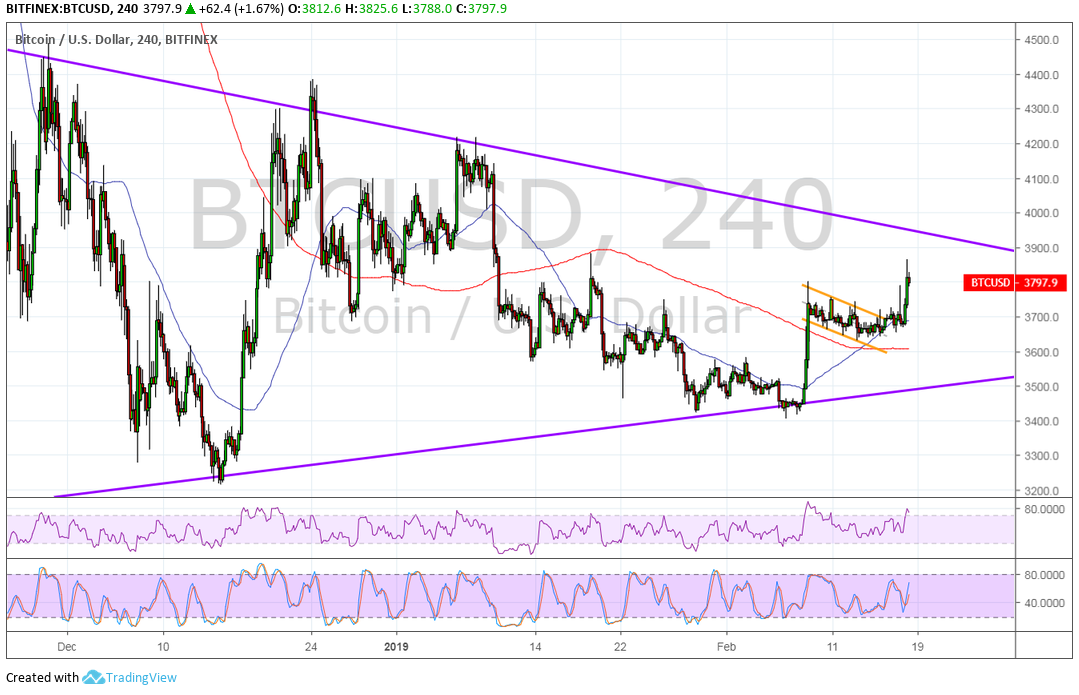
Bitcoin broke above its short-term descending channel to confirm that the climb is gaining traction. This also completes a breakout from the bullish flag continuation pattern, indicating that a climb of the same height as the mast is in order.
The 100 SMA is above the longer-term 200 SMA to confirm that the path of least resistance is to the upside. In other words, the uptrend is more likely to continue than to reverse. This might even lead to a break above the triangle top on the 4-hour time frame.
If so, bitcoin might see a climb that’s the same height as the triangle, which spans $3,300 to $4,400. This might take it all the way up to the forecast of “$5,000 in the next ten days” from the previous week.
So far, the 100 SMA is holding up well as a dynamic support level while the 200 SMA could also hold as a floor near the $3,600 mark in the event of a pullback. A break below the triangle bottom at $3,500 could signal that bearish pressure is back in play.
RSI is already in the overbought zone to indicate that buyers are tired and sellers might take over. In that case, price might also pull back to the broken channel top around $3,700. Stochastic has more room to climb before hitting the overbought zone, which means that buyers could have the upper hand for much longer.
The recent upside break would likely draw more bullish forecasts from analysts, possibly extending the rally even further. Meanwhile, anticipation for the Fidelity institutional platform is also building up as the March launch data approaches.
If this pushes through, a pickup in volumes from institution is expected, likely drawing even more bullish interest. On the other hand, another delay could spur a major correction once more.
By Rachel Lee February 18, 2019