x



Bitcoin price recovered recently above $7,900 and $8,000 against the US Dollar.
The price failed to stay above $8,000, formed a swing high at $8,080, and recently declined below $7,900.
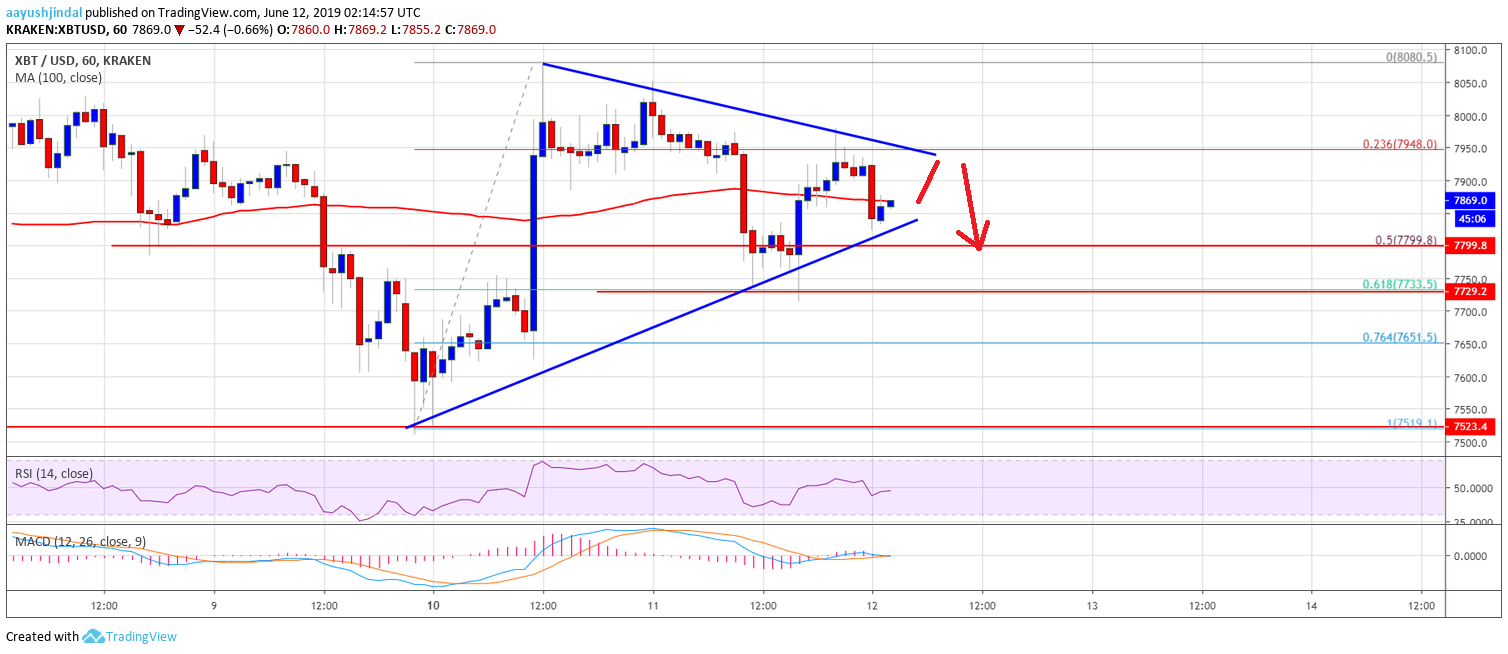
There is a key breakout pattern forming with resistance near $7,940 on the hourly chart of the BTC/USD pair (data feed from Kraken).
The pair is currently under pressure and there is a risk of more losses below the $7,800 support.
Bitcoin price failed to gain momentum above $8,000 and declined recently against the US Dollar. BTC is currently approaching the next break and it might breakdown if the bulls struggle near $7,950.
Bitcoin Price Analysis
Recently, bitcoin price started a decent recovery above $7,800 and $7,900 against the US Dollar. The BTC/USD pair even broke the $8,000 barrier and the 100 hourly simple moving average. However, the price failed to gain bullish momentum and formed a swing high at $8,080. As a result, there was a fresh decline below the $8,000 support area. The price broke the 23.6% Fib retracement level of the recent recovery from the $7,520 swing low to $8,080 high.
There was also a spike below $7,900 and the 50% Fib retracement level of the recent recovery from the $7,520 swing low to $8,080 high. Finally, the price broke the $7,800 support area before the bulls took a stand near the $7,750 level. Moreover, the 61.8% Fib retracement level of the recent recovery from the $7,520 swing low to $8,080 high acted as a strong support. At the moment, the price is trading above $7,800 and the 100 hourly SMA. More importantly, there is a key breakout pattern forming with resistance near $7,940 on the hourly chart of the BTC/USD pair.
Therefore, the pair seems to be preparing for the next break either above $7,950 and $8,000 or below $7,800. If there is an upside break above $8,000, the price is likely to climb further higher. A follow through above $8,080 is likely to put the bulls in control. The next important resistance is near the $8,200 level. On the downside, an initial support is near the $7,800, below which the price could decline again towards $7,600.
Looking at the chart, bitcoin price is showing a few bearish signs below $8,000 and $7,900. If there is a fresh decline below $7,800, the price could move back in a bearish zone. It may also diminish the chances of a break above $8,200.
Technical indicators:
Hourly MACD – The MACD is losing momentum in the bullish zone.
Hourly RSI (Relative Strength Index) – The RSI for BTC/USD is currently below the 50 level and is moving higher.
Major Support Levels – $7,800 followed by $7,700.
Major Resistance Levels – $7,950, $8,000 and $8,080.
Aayush Jindal
1 min ago