x




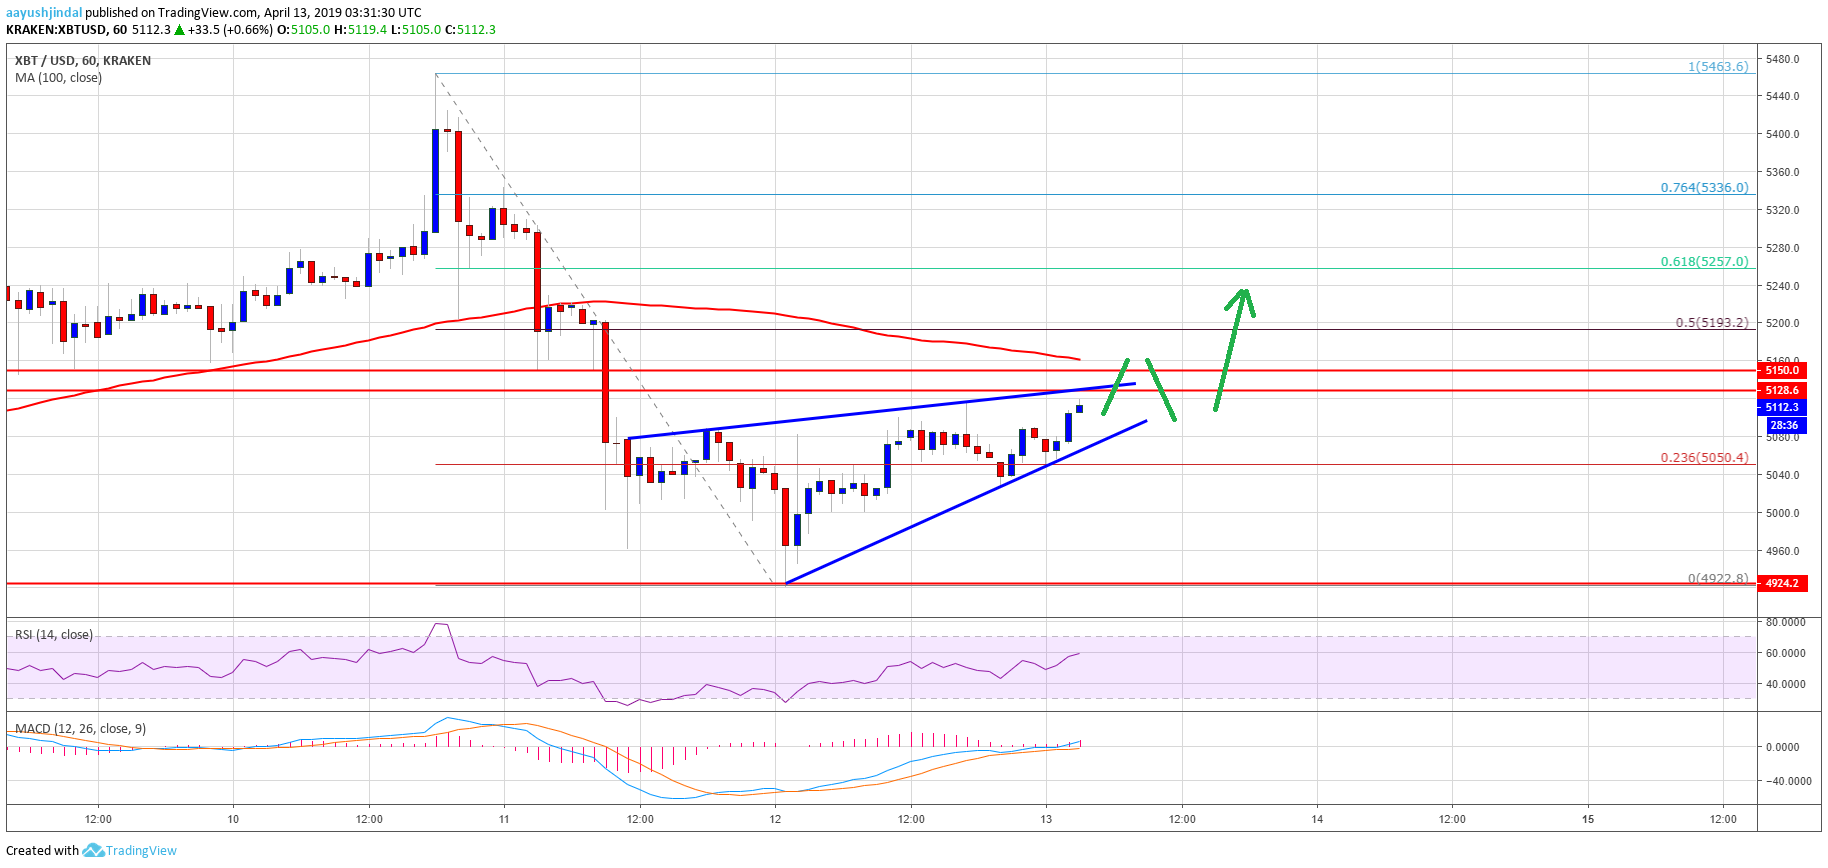
Bitcoin price corrected lower recently and tested the $4,920 support area against the US Dollar.
The price recovered nicely recently and traded above the $5,040 and $5,100 resistance levels.
There is a major breakout pattern in place with resistance at $5,130 on the hourly chart of the BTC/USD pair (data feed from Kraken).
The pair is likely to accelerate higher and it could even surpass the $5,180 and $5,220 resistances.
Bitcoin price likely completed a downside correction near $4,900 against the US Dollar. BTC is grinding higher and the current price action is indicating bullish continuation above the $5,200 level.
Bitcoin Price Analysis
Recently, we saw a solid downside correction from the $5,460 swing high in bitcoin price against the US Dollar. The BTC/USD pair declined below the $5,300 and $5,200 support levels. There was even a close below the $5,200 level and the 100 hourly simple moving average. However, as discussed in one of the recent analysis, bitcoin did find a strong support near the $4.9K-5.0K zone. The price traded towards the $4,900 support and formed a low near the $4,922 level.
Recently, there was a solid upward move and the price recovered above the $5,000 and $5,040 resistance levels. There was even a close above the $5,080 level and the 23.6% Fib retracement level of the last decline from the $5,462 high to $4,922 low. The price is now approaching a significant resistance near the $5,150 level. Besides, the 100 hourly SMA is also positioned near the $5,160 level to act as a resistance. More importantly, there is a major breakout pattern in place with resistance at $5,130 on the hourly chart of the BTC/USD pair.
Above $5,160, the price could test the 50% Fib retracement level of the last decline from the $5,462 high to $4,922 low. If bitcoin gains pace above the $5,180 and $5,200 resistance levels, there could be a solid upward move towards the $5,300 and $5,350 levels. In the mentioned case, the crypto market could gain traction, with bullish moves in Ethereum, ripple, litecoin and others.
Looking at the chart, bitcoin price is showing signs of a solid comeback above $5,100. Having said that, bulls need to surpass the $5,180 and $5,200 resistance levels. If they fail, the price may decline once again below the $5,100 and $5,040 support levels. On the upside, the main target for bulls could be $5,350.
Technical indicators:
Hourly MACD – The MACD is slowly gaining momentum in the bullish zone.
Hourly RSI (Relative Strength Index) – The RSI for BTC/USD is back above the 50 level, with a bullish angle.
Major Support Levels – $5,040 followed by $5,000.
Major Resistance Levels – $5,150, $5,180 and $5,200.
AAYUSH JINDAL | APRIL 13, 2019 | 4:08 AM