x





Bitcoin Price Key Highlights
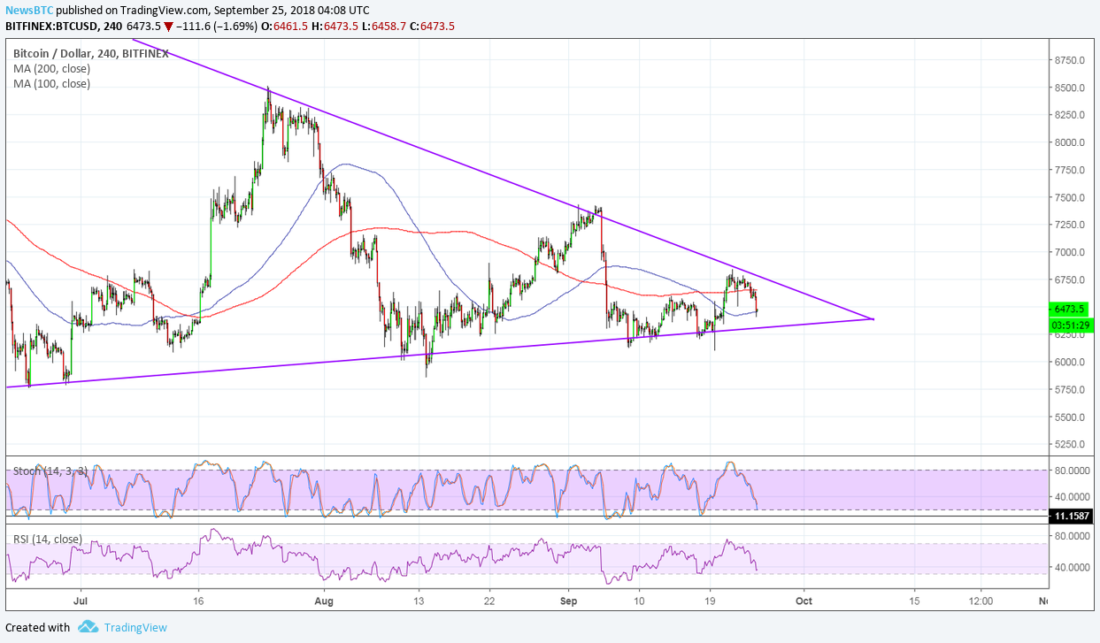
Bitcoin price has formed higher lows and lower highs to trade inside a triangle pattern on its 4-hour time frame.
Price got rejected on a test of resistance once more and a move to support appears to be taking place.
Technical indicators are suggesting that further declines could be in the cards.
Bitcoin price bounced off the top of its triangle consolidation pattern and is gearing up for another test of support.
Technical Indicators Signals
The 100 SMA is below the longer-term 200 SMA to signal that the path of least resistance is to the downside. In other words, support is more likely to break than to hold. Price is currently testing the 100 SMA dynamic inflection point and might be due for further losses if it breaks below this level or the $6,250 triangle bottom.
Stochastic is also heading south so bitcoin price might follow suit while sellers have the upper hand. This oscillator is nearing oversold levels, though, so bears might be feeling exhausted soon. RSI is pointing down and has more room to fall before hitting oversold levels, so sellers could stay in control for a bit longer.
The chart pattern spans $6,000 to around $8,250 so a break lower could be followed by a drop of the same height. Similarly an upside break could lead to a rally that’s the same height as the triangle.
Bitcoin price has drawn support from the SEC decision to open the comment period for the proposed rule change to list the bitcoin ETF by VanEck/SolidX on an exchange. This keeps traders’ hopes up that an approval may be in the works sooner or later as it managed to avoid a quick rejection.
Meanwhile, there appears to be no major catalyst that has spurred the sharp tumble, apart from profit-taking. Some point to the BIS report that regulation has been a driving factor for bitcoin price also.
SARAH JENN | SEPTEMBER 25, 2018 | 4:34 AM