x





Bitcoin Price Key Highlights
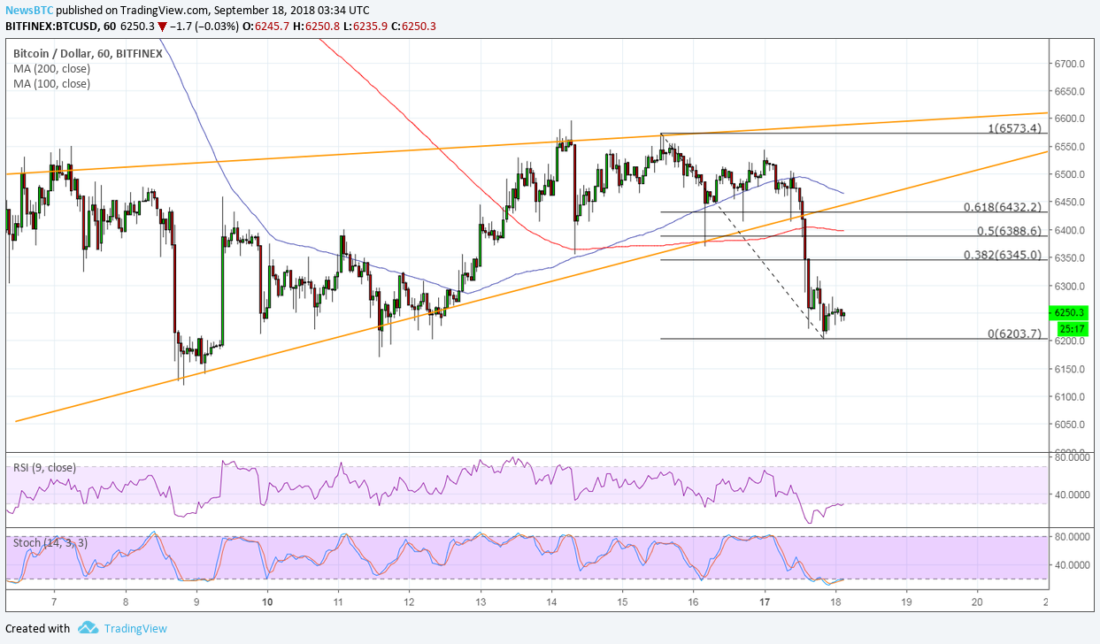
Bitcoin price recently broke below a rising wedge pattern to signal that further losses are in the cards.
Price might still pull back to the broken support area, which lines up with Fib levels, to gather more selling pressure.
Technical indicators are showing that there is still some bullish momentum left.
Bitcoin price made a downside break from its rising wedge pattern but might be due for a pullback before heading further down.
Technical Indicators Signals
The 100 SMA is above the longer-term 200 SMA to indicate that the path of least resistance is still to the upside. In other words, there still might be a chance for the uptrend to resume.
However, the gap between the two is narrowing to reflect weaker bullish momentum and a possible downward crossover. Bitcoin price has also tumbled below both moving averages, so these might hold as dynamic resistance moving forward.
RSI is turning higher after recently dipping into oversold territory, suggesting a possible return in bullish pressure. Stochastic also looks ready to climb out of the oversold region and bitcoin price could follow suit once it heads north.
However, price could hit roadblocks at the Fib levels marked on the breakdown. The 61.8% Fib lines up with the broken wedge support around $6,430 and the 50% Fib lines up with the 200 SMA dynamic inflection point. If any of these levels keep gains in check, bitcoin price could resume the slide to the swing low or lower.
Risk aversion has returned to broader financial markets on account of the fresh set of tariffs imposed by the US on China. These tariffs, which are due to take effect on September 24, levy 10% of duties on $200 billion worth of Chinese goods and the rate would increase to 25% by the end of the year.
With that, it’s understandable that traders are dumping their riskier holdings and flocking back to the safe-havens. Cryptocurrencies have been deep in the red once more, with declines led by ethereum.
SARAH JENN | SEPTEMBER 18, 2018 | 3:52 AM