x



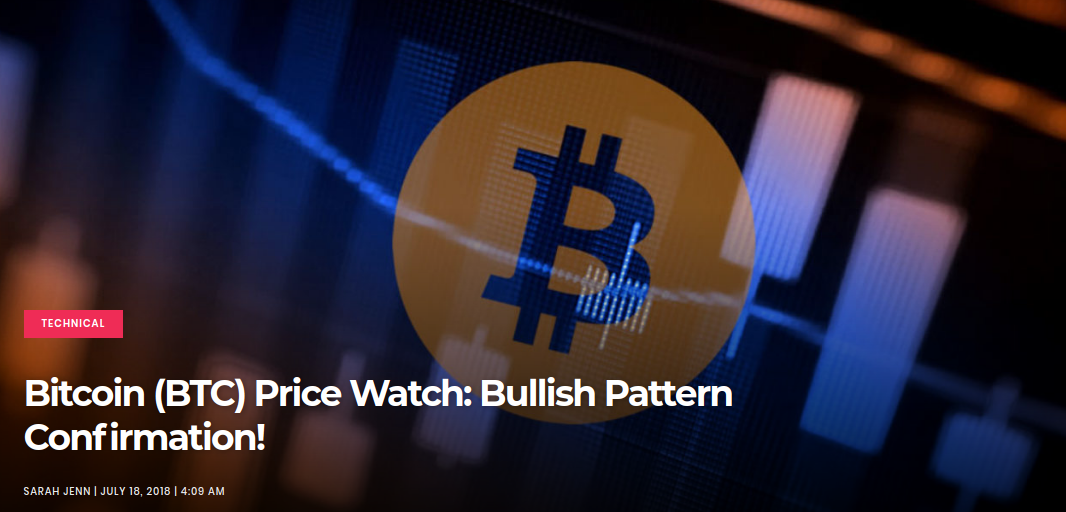
Bitcoin price finally broke above the neckline of its inverse head and shoulders pattern to signal that a rally is underway.
The chart pattern is around $1,000 tall so the uptrend has room to go, but a pullback might take place.
Technical indicators are showing mixed signals while sentiment favors more bitcoin price gains.
Bitcoin price made a strong upside break from the neckline of its inverse head and shoulders pattern.
Technical Indicators Signals
The 100 SMA just crossed above the longer-term 200 SMA to indicate that the path of least resistance is to the upside. This confirms that the reversal is more likely to gain traction than to retreat.
The chart pattern spans $5,800 to $6,800 so the resulting uptrend could be of the same size. This could be enough to take bitcoin price to $7,800 so it’s not too late to join the rally. However, stochastic is already indicating overbought conditions so there may be some profit-taking here.
Once the oscillator heads south, bitcoin price might follow suit and retest the broken neckline before resuming the climb. Stochastic is also in overbought territory to indicate that buyers are exhausted and that sellers might take over.
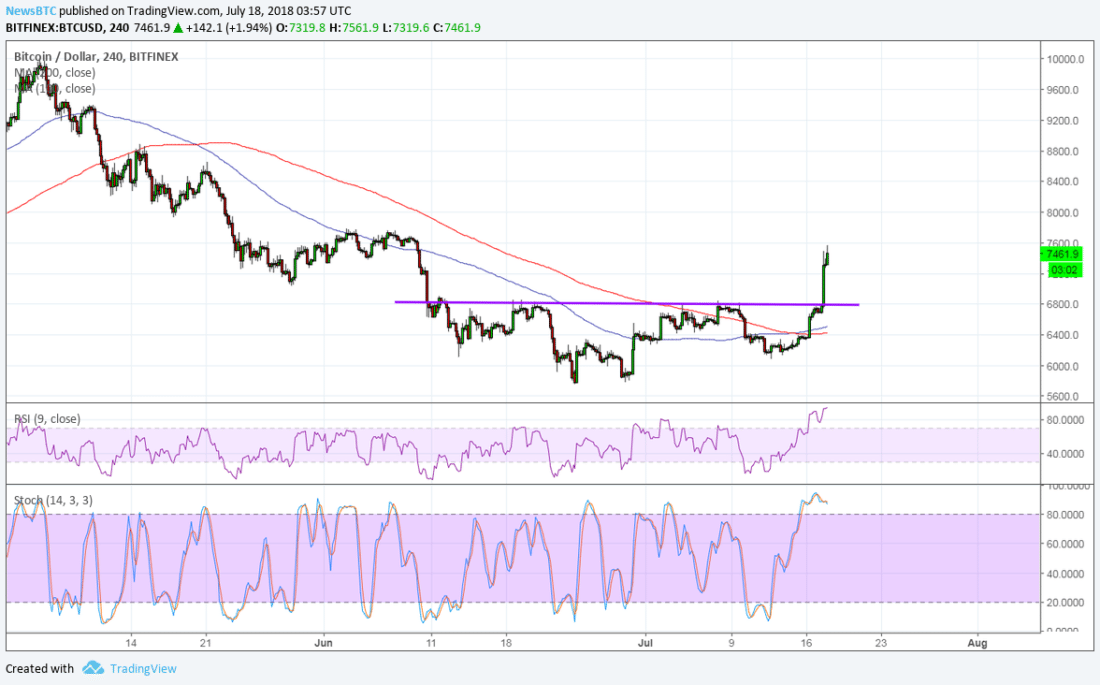
BTCUSD Chart from TradingView
Market Factors
The recent run higher is being attributed to the pickup in institutional interest after it was reported that hedge funds are looking to invest in the space. In particular, confirmation from BlackRock’s CEO that the world’s largest asset manager formed a team to look at crypto investments drew traders back to bitcoin.
It’s worth noting that the US dollar also had a good run in recent sessions but proved no match to bitcoin strength. Risk appetite popped back in the US session and investor confidence may have also contributed to bitcoin price gains.
Positive views on the regulatory moves in South Korea are also being lauded for shoring up the legitimacy of the cryptocurrency market. Although other notable developments were reported in the past weeks, it seems that most
SARAH JENN | JULY 18, 2018 | 4:09 AM