x





Bitcoin Price Key Highlights
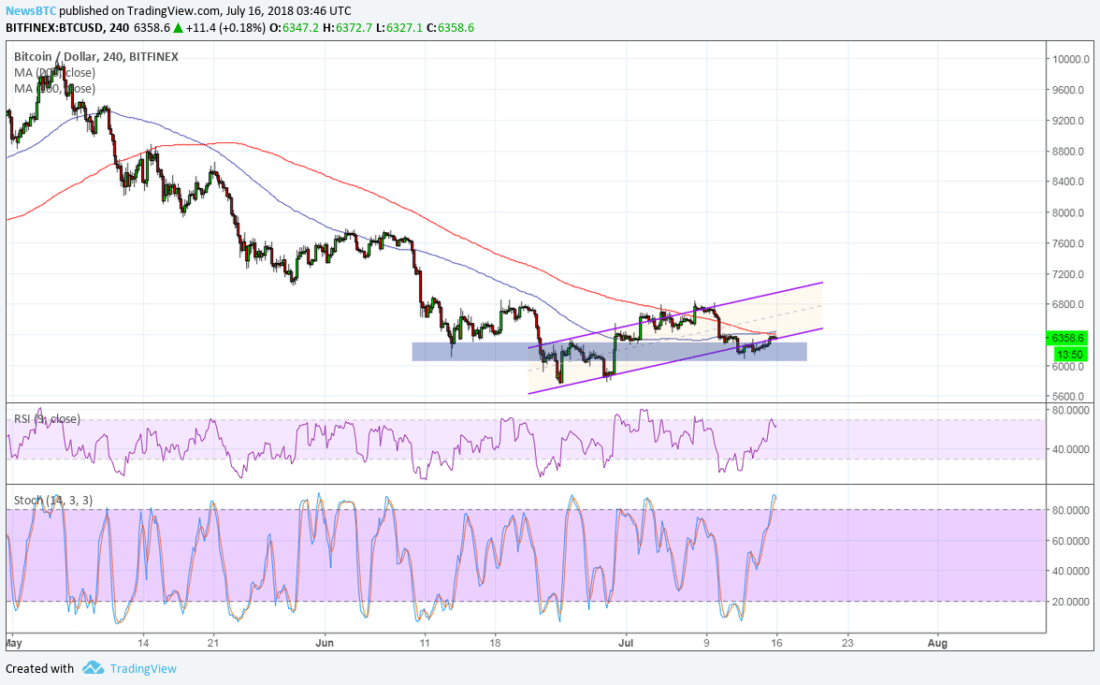
Bitcoin price appears to be keeping its head above the near-term area of interest at the channel support.
If a bounce back to the resistance happens, an inverse head and shoulders pattern could also be completed.
A break past the channel top could be enough to confirm that a long-term uptrend is underway.
Bitcoin price is staying above the $6,300 area of interest to signal that bulls are putting up a good fight.
Technical Indicators Signals
The 100 SMA is starting to cross above the longer-term 200 SMA to suggest that bearish momentum is over and that the path of least resistance is to the upside. This means that the reversal could gain more traction from here, especially once the crossover is completed.
In that case, support at the ascending channel could keep holding as this lines up with an area of interest or former support and resistance level. Price could find its way back to the channel top at $7,200, which would also be above the neckline of a reversal pattern.
Bitcoin price continues to attempt to complete the inverse head and shoulders formation on this 4-hour time frame, and this is considered a potent reversal signal. The pattern would span $5,800 to $6,800 or $1,000 in height, so the resulting uptrend could be of at least the same size.
However, RSI is already closing in on the overbought zone and is showing intention to head back down. This could mean that sellers are eager to push bitcoin price south again. Similarly stochastic is starting to turn upon reaching overbought territory so bitcoin could follow suit.
Market Factors
Bitcoin price was off to a rallying start in July but most of these gains were returned last week on negative commentary and another exchange hack. US authorities also indicted twelve Russian officials for using cryptocurrency in interfering with the 2016 elections.
This time, the focus could remain on related headlines that could determine whether the bullish run could resume or if another set of downbeat updates could force a continuation of the earlier slide
SARAH JENN | JULY 16, 2018 | 3:57 AM