x





Bitcoin Price Key Highlights
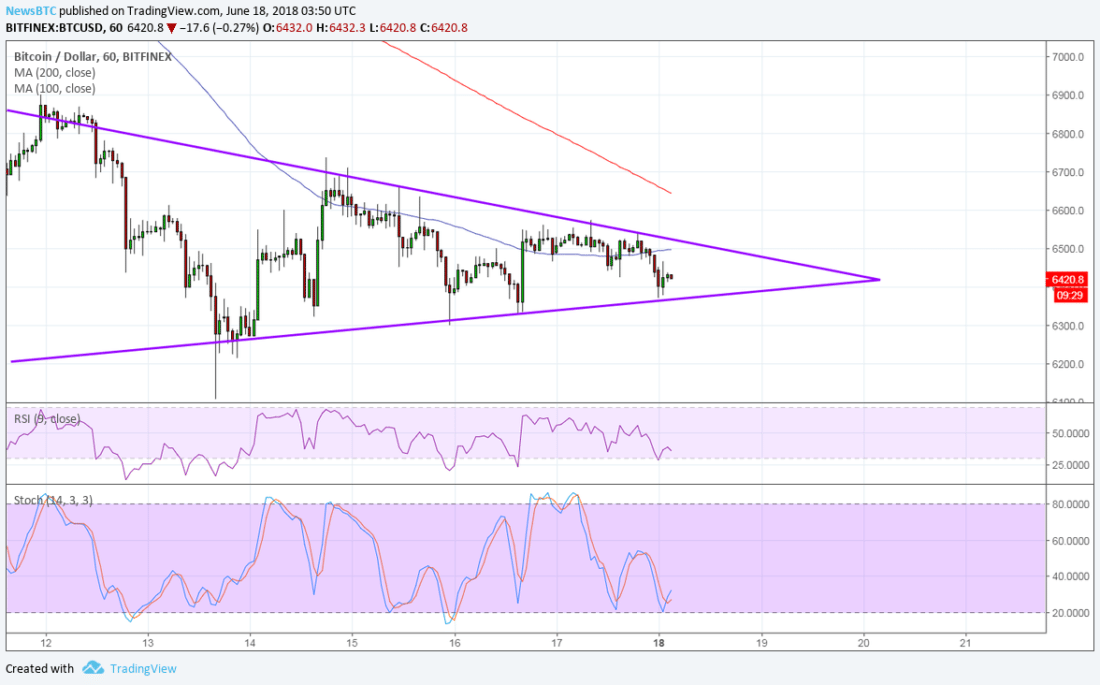
Bitcoin has formed lower highs and higher lows to trade inside a symmetrical triangle pattern on its 1-hour chart.
Zooming out to longer-term time frames shows that this might be a bearish flag continuation pattern.
Price is nearing the peak of the formation to signal that a breakout in either direction is due soon.
Bitcoin price is consolidating inside a short-term symmetrical triangle pattern as bulls and bears wait for more decisive clues.
Technical Indicators Signals
The 100 SMA is below the longer-term 200 SMA on this time frame to signal that the path of least resistance is to the downside. This means that the selloff is more likely to resume than to reverse. The 100 SMA has held as dynamic resistance as well.
However, the gap between the moving averages has narrowed significantly to signal a slowdown in bearish pressure. This could also signal an imminent bullish crossover that could draw more buyers in and spur a reversal from the bitcoin price downtrend.
RSI still seems to be heading lower, though, so sellers might still have some energy to push for a break below support. The triangle spans $6,200 to $,6900 so the resulting breakout could be of the same size. Stochastic, on the other hand, appears to have bottomed out and is ready to turn higher.
Market Factors
Dollar strength kicked into high gear on Friday when the Trump administration imposed tariffs on Chinese goods and China retaliated with their own measures on US exports. Further escalation of these tensions could keep traders flocking to the safe-haven dollar and away from riskier assets like bitcoin.
Besides, the lack of positive updates from the industry has kept bitcoin price in consolidation, even after a senior SEC official suggested that it isn’t subject to securities regulation. After all, this hardly constitutes an official ruling so investors are waiting to hear more remarks from other regulators.
SARAH JENN | JUNE 18, 2018 | 4:03 AM