x




Bitcoin Price Key Highlights
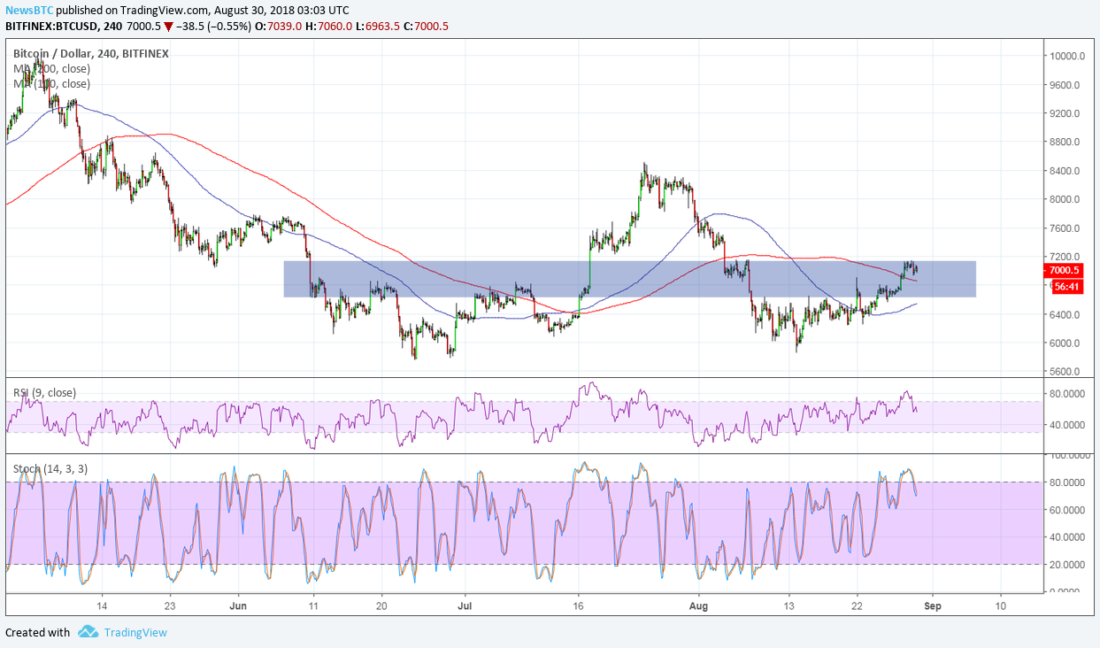
Bitcoin price is once again attempting to break past the key $7,000 barrier on its climb.
If it does, bullish pressure could kick in and complete the formation of a long-term double bottom reversal pattern.
The pattern’s neckline would be at the $8,400 mark and a break higher could spur a prolonged rally.
Bitcoin price is back to the key $7,000 mark and a strong upside break could confirm that a big rebound is in order.
Technical Indicators Signals
The 100 SMA is below the longer-term 200 SMA on this time frame to signal that the path of least resistance is still to the downside. In other words, resistance is more likely to hold than to break.
However, the gap between the two indicators has narrowed significantly to indicate that a bullish crossover may be in the works. In that case, more buying pressure could be seen once completed, giving bitcoin price enough energy to sustain a move past $7,000.
This would put in on track towards testing the neckline around $8,400 to $8,500 and complete a large double bottom pattern. This reversal formation would span around $2,700 in height, which suggests that the resulting move could be roughly the same size.
RSI is still heading lower for now, though, so sellers might have the upper hand. Similarly stochastic is moving south so bitcoin price could follow suit while sellers stay in control. Sustained bearish momentum might even lead to another test of the bottoms at $5,800.
BTCUSD Chart from TradingView
However, the mood is somewhat positive in the industry as investors await the SEC decision on pending bitcoin ETF applications. To top it off, risk appetite has been evident in global financial markets thanks to developments in NAFTA and Brexit.
It might take an industry-specific catalyst to sustain any potential rallies, though, and it’s likely that the regulator’s ruling could do the trick. Approval could bring stronger volumes and increased activity for bitcoin and its peers.
Sarah Jenn - NewsBTC - 1 hour ago