x





Bitcoin Price Key Highlights
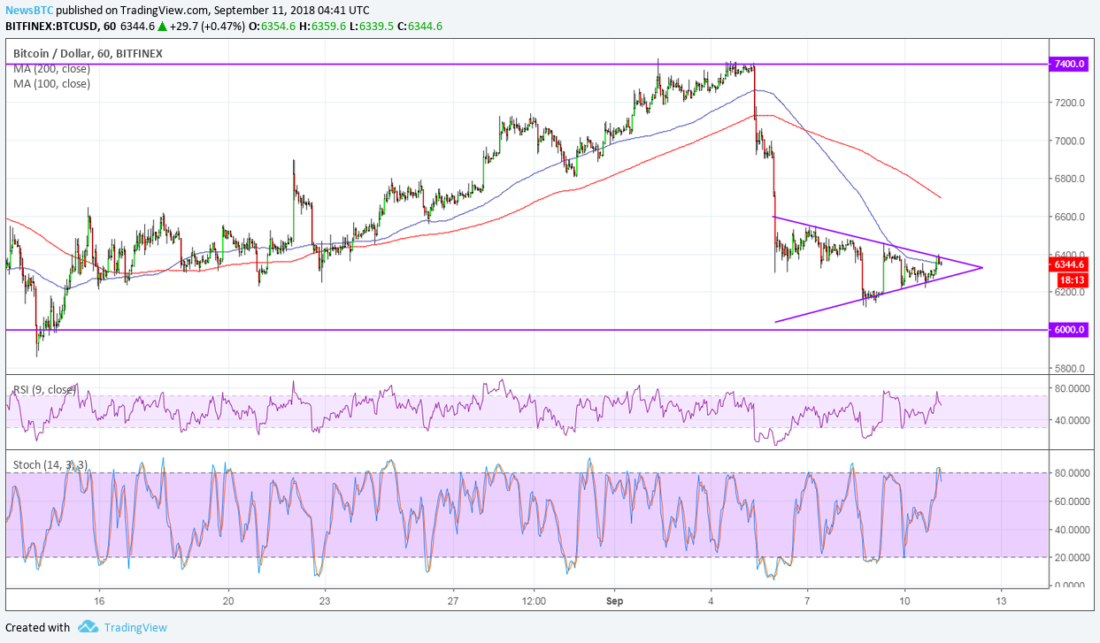
Bitcoin price is currently consolidating in a short-term symmetrical triangle visible on the 1-hour chart.
The breakout could set the longer-term direction for bitcoin as it nears a key support area.
Technical indicators are suggesting that a downside move is more likely to happen than an upside break.
Bitcoin is consolidating inside a symmetrical triangle, which might be a bearish continuation pattern from the earlier drop.
Technical Indicators Signals
The 100 SMA is below the longer-term 200 SMA to indicate that the path of least resistance is to the downside. In other words, the selloff is more likely to resume than to reverse. The 100 SMA also lines up with the top of the triangle to add to its strength as resistance also.
The gap between the moving averages has been widening to reflect stronger bearish pressure. A break below the $6,250 level could be enough to signal a bearish break and further losses, possibly by the same height as the mast of the flag that spans $7,400 to around $6,200.
RSI is already turning lower after spending a brief period in overbought levels, indicating that bears are eager to return. Stochastic is also pointing back down and may draw more selling pressure.
Market Factors
Bitcoin was off to a terrible start for the week on reports that the SEC decided to suspend trading in a couple of crypto-based securities. This weighed on odds that the regulator could approve the bitcoin ETF applications anytime soon as they could site similar reasons on their ruling.
However, it’s worth noting that there were some positive updates so far this week, including the NYDFS backing of the Winklevoss twins’ fiat-based stablecoin. There have also been developments in Canada as a bitcoin fund achieved mutual fund trust status, allowing unit holders to put units in a self-directed registered account such as an RRSP or TFSA.
SARAH JENN | SEPTEMBER 11, 2018 | 4:54 AM