x





Bitcoin Price Key Highlights
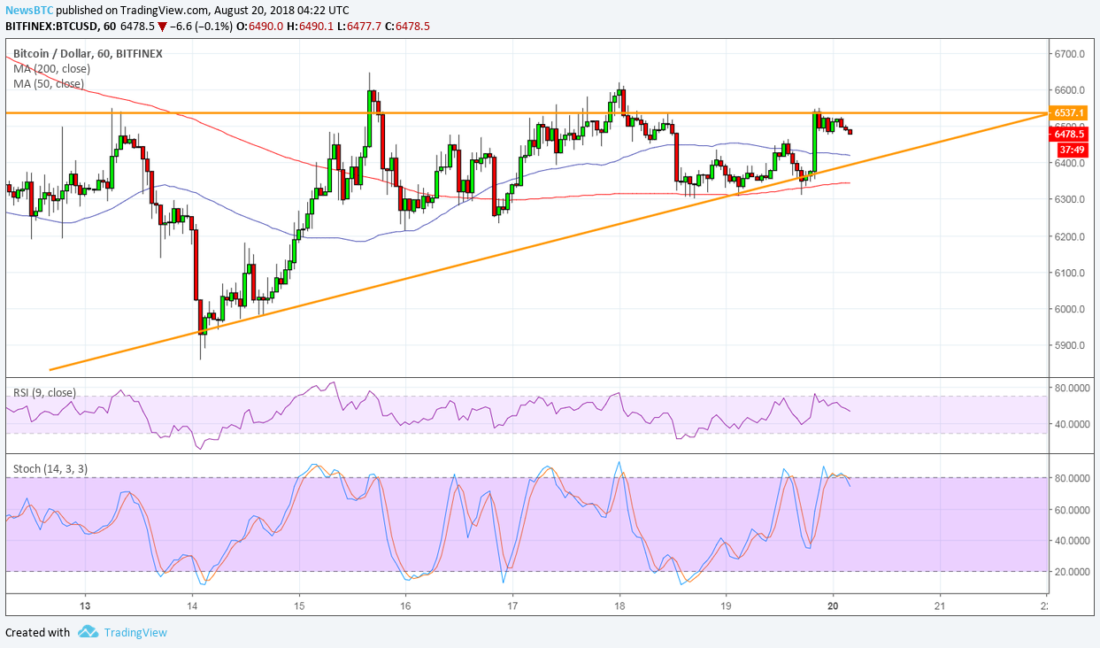
Bitcoin price has formed higher lows and found resistance around $6,500 to create an ascending triangle pattern on its 1-hour chart.
Price is currently testing the resistance and is nearing the peak of the formation, so a breakout might be due soon.
Technical indicators are giving mixed signals on which direction the breakout might take.
Bitcoin price is consolidating inside an ascending triangle pattern and might be due for a breakout in either direction soon.
Technical Indicators Signals
The 100 SMA is above the longer-term 200 SMA to signal that the path of least resistance is to the upside. This suggests that an upside break is more likely to occur than a break lower. Also, the moving averages are near the triangle bottom to add to its strength as a floor around $6,400.
RSI is heading lower to signal that selling pressure is in play and that resistance would likely hold for now. Stochastic is also in the overbought region and turning lower suggests a pickup in bearish momentum. The chart pattern is around $600 in height so the resulting rally or selloff after a breakout could be of the same size.
Market Factors
Bulls continue to defend long-term support levels for bitcoin, so there’s a strong chance that the floor won’t be giving way anytime soon. Buyers now have another attempt to spur a larger rebound, possibly one that could last longer on a break of nearby resistance levels.
The anticipation for the SEC decision on the bitcoin ETF applications put on hold is building up as the end of the month nears and September approaches. However, a denial could still lead to another round of losses for bitcoin and its peers while approval might see sustained gains.
Other factors pushing bitcoin around include trade-related updates and potential contagion coming from Turkey, so price could stay sensitive to headlines from here.
SARAH JENN | AUGUST 20, 2018 | 4:38 AM