x





Bitcoin Price Key Highlights
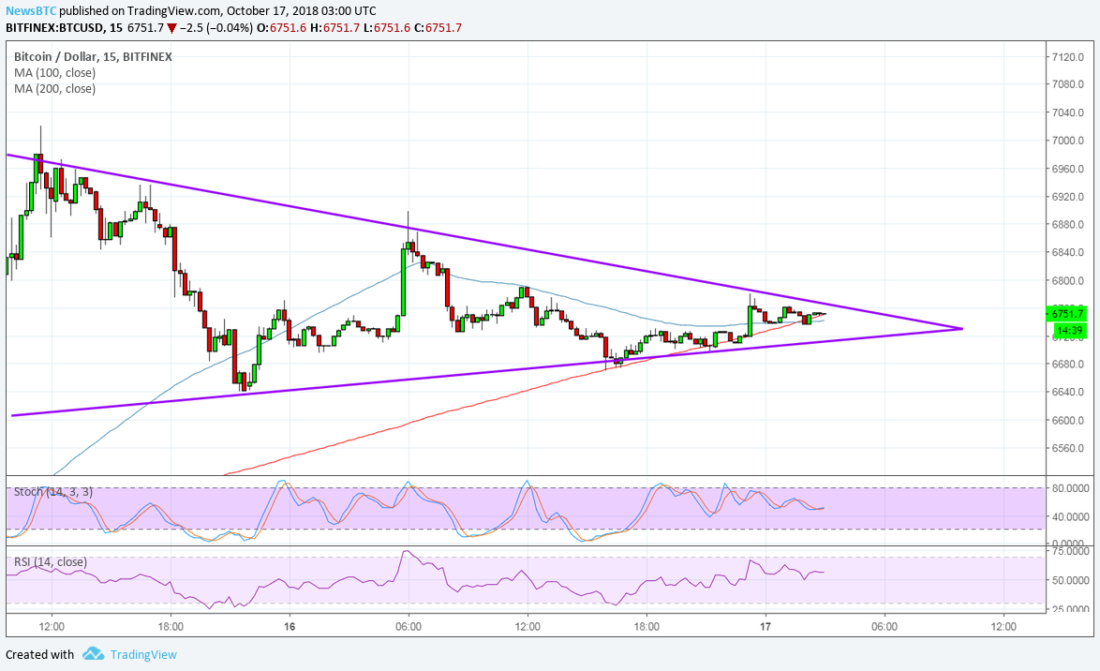
Bitcoin price is still stuck in consolidation, forming higher lows and lower highs inside a symmetrical triangle on the short-term chart.
Price is approaching the peak of this formation so a breakout might be due soon, providing longer-term directional clues.
Technical indicators are giving mixed signals, although there seems to be some bearish pressure in play.
Bitcoin price is consolidating inside a symmetrical triangle on the short-term charts while traders decide which direction to take.
Technical Indicators Signals
The 100 SMA crossed below the longer-term 200 SMA on this time frame, indicating that the path of least resistance is to the downside. In other words, support is more likely to break than to hold, possibly leading to a slide that’s at least the same height as the triangle. This pattern spans $6,640 to around $$7,000.
Stochastic is on the move down to show that sellers are in control and could push for a break below the triangle bottom. RSI also seems to be moving south to signal that bearish pressure could stay in play as the oscillator has plenty of room to move down before hitting oversold levels.
The recent surge in bitcoin price is being pinned on the Tether selloff, although the launch of Fidelity’s institutional platform might be a bigger factor sustaining longer-term gains. After all, this could open bitcoin and ethereum to stronger volumes and increased trading activity from bigger market players.
A candle closing past the $6,750 triangle resistance could be enough to signal an upside break and a continuation of the rally from the larger triangle breakouts. A break below the $6,675 level, on the other hand, could lead to a test of the nearby support zones, although it’s worth noting that bulls are strongly defending the lows by buying on dips.
SARAH JENN | OCTOBER 17, 2018 | 3:54 AM