x





Bitcoin Price Key Highlights
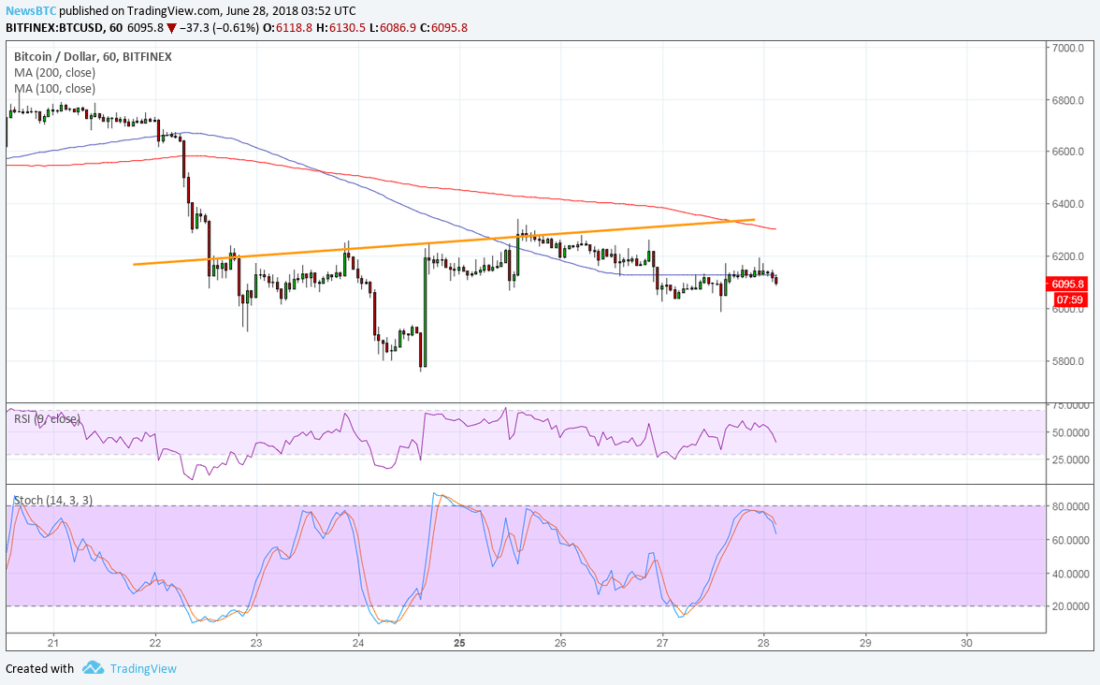
Bitcoin price could be forming a short-term inverse head and shoulders pattern.
Price has been moving sideways for the past few days as bulls try to keep it afloat.
Technical indicators, however, seem to be favoring further declines in bitcoin price.
Bitcoin price seems to be fighting to stay afloat, but technical indicators suggest that further losses are in the cards.
Technical Indicators Signals
The 100 SMA is still below the longer-term 200 SMA on the 1-hour chart to signal that the path of least resistance is to the downside. This means that the selloff is more likely to resume than to reverse.
In addition, the 100 SMA is holding as dynamic resistance at the moment. Then again, the gap between the moving averages is narrowing to reflect slowing bearish momentum. A rally towards the 200 SMA dynamic inflection point and beyond it could be followed by a bullish crossover.
RSI is heading lower, though, so sellers still have the upper hand. Similarly stochastic is moving down without even hitting overbought levels, which also indicates that bears are eager to return.
Still, a break past the potential inverse head and shoulders neckline around $6,400 could be followed by a rally of around $600 or the same height as the chart formation. If resistance continues to hold, bitcoin price could revisit the lows around $5,800.
CoinMarketCap is reporting an increase in bitcoin interest under their Dominance Index, signaling that investors are revisiting cryptocurrencies as potential higher-yielding holdings. After all, trade troubles are weighing on global stock markets and commodities, so demand for riskier assets may be routed to digital currencies like bitcoin instead.
This phenomenon was observed in a few instances over the past years, such as the resurgence of Greece’s debt troubles that weighed heavily on European markets. This also drove traders to bet on alternative markets outside of traditional ones that are more vulnerable to geopolitical risk.
SARAH JENN | JUNE 28, 2018 | 4:03 AM