x




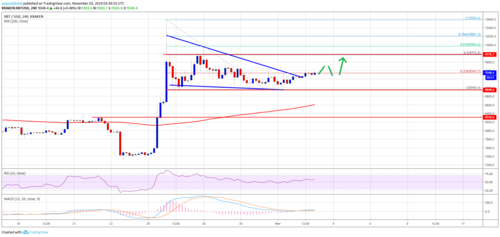
There are positive signs emerging for bitcoin above the $9,200 support against the US Dollar.
The price is slowly moving higher and it could retest the $9,770 resistance area in the near term.
There was a break above a key contracting triangle with resistance near $9,240 on the 4-hours chart of the BTC/USD pair (data feed from Kraken).
The price remains well supported and it could even surge above $9,800 in the coming days.
Bitcoin price is trading above key supports near $9,000 and $9,200 against the US Dollar. BTC must stay above $8,600 to remain in uptrend and start a fresh increase.
Bitcoin Price Weekly Analysis (BTC)
This past week, there was a slow and steady decline in bitcoin below the $8,400 support against the US Dollar. Moreover, BTC price also traded below the $8,200 support area. Finally, it spiked below the $8,000 support, but remained well above the 100 simple moving average (4-hours).
A swing low was formed near $8,960 and the price recently started an upward move. There was a break above the $8,100 and $8,200 resistance levels to start a decent increase.
More importantly, there was a break above a key contracting triangle with resistance near $9,240 on the 4-hours chart of the BTC/USD pair. At the moment, the price is trading near the 23.6% Fib retracement level of the downward move from the $10,584 high to $8,960 low.
If there are more gains, the price could continue to rise towards the $9,500 and $9,600 resistance levels. Besides, the main resistance is near the $9,770 level. It represents the 50% Fib retracement level of the downward move from the $10,584 high to $8,960 low.
On the downside, there are many supports between $9,200 and $8,960. If there is a bearish break below the $8,960 swing low, there are chances of a sharp decline. The next key support is near $8,600 and the 100 simple moving average (4-hours).
Therefore, the $8,500 and $8,600 support levels are likely to play an important role. As long as the price is above the $8,500 support, there are chances of a fresh increase above the $9,500 level.
.png)
Bitcoin Price
Looking at the chart, bitcoin price is clearly showing signs of bullish continuation above $9,500. Having said that, a clear break above the $9,500 and $9,770 resistance levels is needed for uptrend acceleration. In the mentioned case, the price is likely to revisit $10,580.
Technical indicators
4 hours MACD – The MACD for BTC/USD is slowly gaining pace in the bullish zone.
4 hours RSI (Relative Strength Index) – The RSI for BTC/USD is now moving well above the 50 level.
Major Support Level – $8,960
Major Resistance Level – $9,500
Aayush Jindal