x




![Bitcoin [BTC] Technical Analysis - Bull carries coin to green pastures](http://seriouswealth.net/wp/wp-content/uploads/2019/01/vw-bus-1845719_960_720-e1546260811706.jpg)
As the year comes to an end, Bitcoin [BTC] marks the end with a little slip. BTC, at the time of press, had slipped by 2.38% over the past 24 hours.
The coin was valued at $3,792.32 with a market cap of $66 billion. The coin registered a 24-hour trade volume of $4.7 billion with a fall of over 9% over the past seven days. The coin is still falling with a slip of 1.10% over the last hour.
1-hour
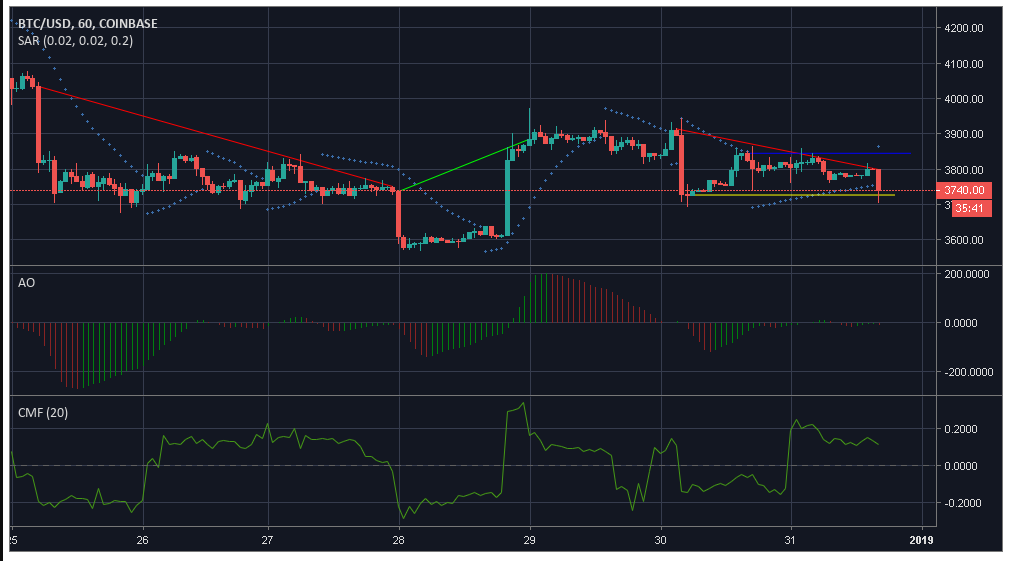
As per the one-hour chart of BTC, the coin observed a downtrend from $4034 to $3748.09, after which the coin shot up to $3736.51 to $3884.71. The coin then fell from $3914.04 to $3799.26. The coin is offered support at $3727, with immediate resistance at $3845.
Parabolic SAR hints towards a bearish as the markers align above the candlesticks.
Awesome Oscillator indicates a bearish momentum emerging, but as per the previous trend, it might be a short-lived one.
Chaikin Money Flow points above zero, marking a bullish market.
1-day
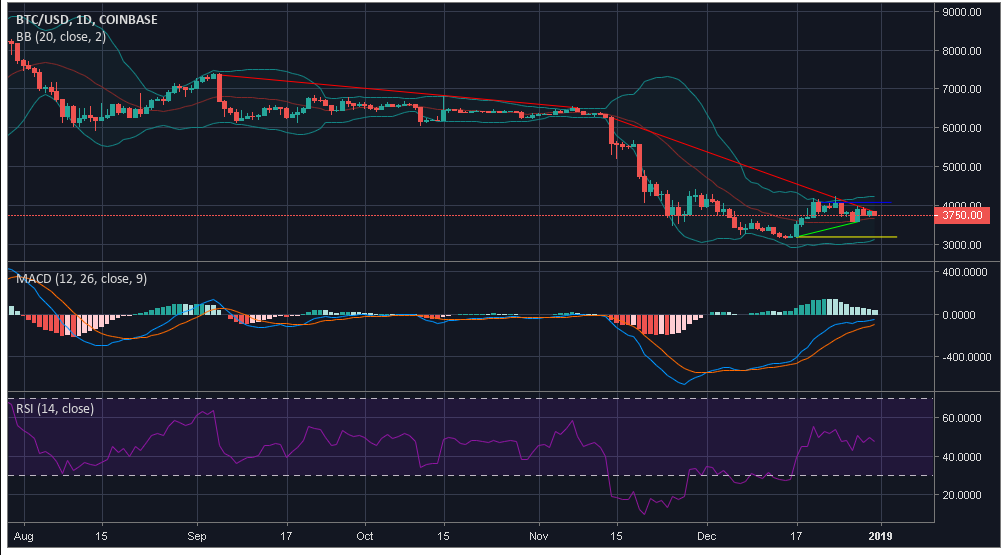
The one-day chart of the coin points towards a massive fall from $7359.99 to $6511.88, which further continues to $6259.35 to $3829. A miniscual uptrend was noticed from $3184.28 to $3576.12, with a resistance marked at $4075.33. BTC was offered support at $3184.28.
Bollinger Bands appears to be at a converging point, indicating a decreased volatility in the market. The moving average line is under the candlesticks, thus marking a bullish market.
MACD line is above the signal line hinting towards a bullish market.
Relative Strength Index indicates that the buying and selling pressures are evening each other out.
Conclusion
According to the indicators, Awesome Oscillator and Parabolic SAR a bearish market is predicted. However, Chaikin Money Flow, Bollinger Bands, and MACD point towards a bullish market.
Published 1 min ago on January 1, 2019 By Namrata Shukla