x




![Bitcoin [BTC/USD] Technical Analysis -Prices climb up as the bulls are back in town](http://seriouswealth.net/wp/wp-content/uploads/2018/12/Untitled-4.png)
Bitcoin prices have been seeing a lot of bull rallies right from the start of December since the month holds a lot of sentiments from last year.
At the time of writing, the prices were trading at $4,180 with a market cap of almost $73 billion. The 24-hour trading volume can be seen holding strongly at a massive $7 billion.
Most of the trading volume comes from BitMEX via the trading pair BTC/USD, which contributes a whopping $2 million trading volume.
1 Hour
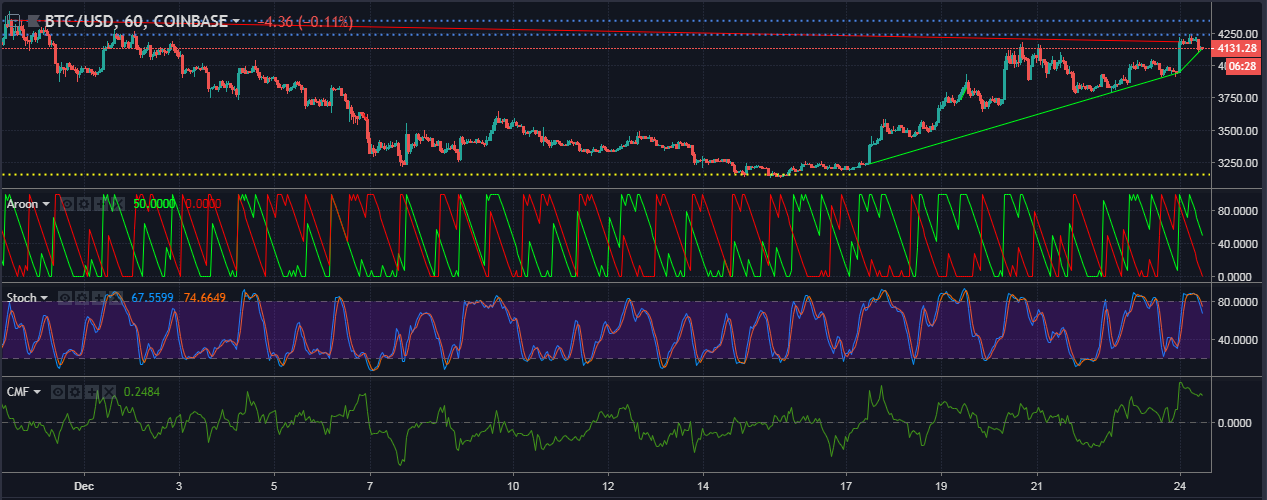
The uptrend for Bitcoin in the one-hour chart seems very bullish as it spans from $3,240 to $4,120, while the downtrend has diminished in size and length as it extends from $4,350 to $4,185. The support for Bitcoin is holding strong at $3,160, while the resistance points are seen hanging above at $4,240 and $4,345.
The Aroon indicator shows that the uptrend for Bitcoin reached the maximum level and is now slowly fading away as it declines towards the zero-line.
The stochastic indicator shows the same as Aroon, as the Stochastic lines reached the top-most level in a bullish crossover and are now heading down in a bearish crossover.
The Chaikin Money Flow shows an overflow of money into the Bitcoin markets as the CMF has hit the top, and is heading down.
1 Day
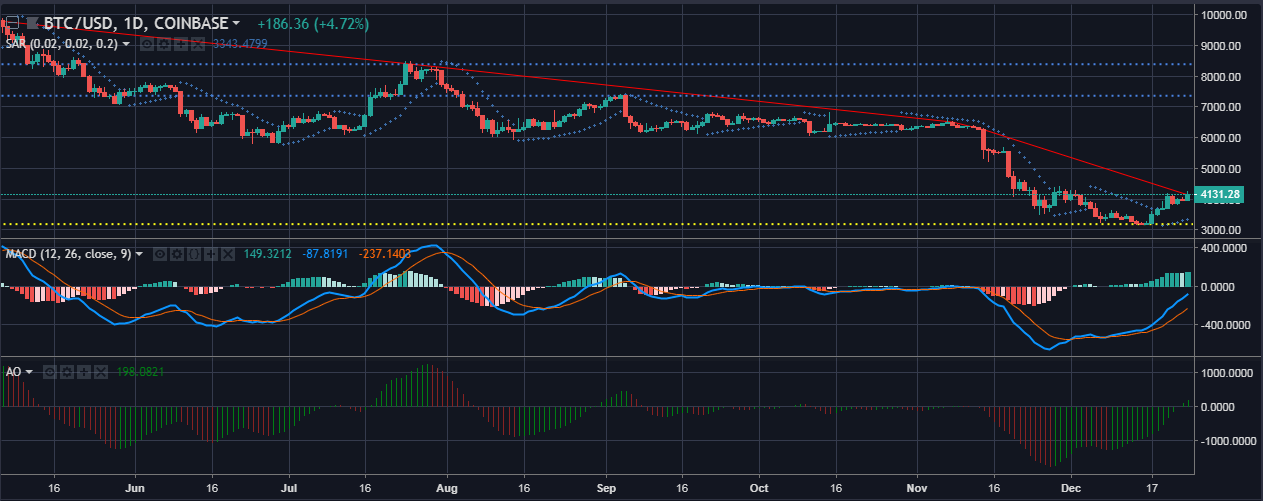
The downtrend for Bitcoin in the one-day chart extends from $9,800 to $4,140 without an uptrend erupting yet. The support for prices can be seen at $3,185 with resistance lines holding the prices from crossing at $8,385 – $7,360.
The Parabolic SAR markers are formed below the price candles which indicates a bullish future for the Bitcoin prices in the larger time frame.
The MACD indicator which had dipped during the sell-off is now recovering in an upward fashion after undergoing a bullish crossover that hasn’t ended yet. The histogram is lit up with green bars above the zero-line.
The Awesome Oscillator shows a bearish crossover as well with the bars that are extending above the zero-line.
Conclusion
The one-day chart shows a decline in Bitcoin’s prices after a brief rally, the same is indicated by the Aroon, Stochastic and the CMF indicators. The one-day chart for Bitcoin shows a positive outlook as indicated by Parabolic SAR, MACD and the Awesome indicators.
Published 7 mins ago on December 25, 2018
By Akash Girimath