x




Key Points
· Bitcoin cash price recovered further, but it failed to move above the $540 resistance area against the US Dollar.
· There is an expanding triangle forming with current support at $492 on the hourly chart of the BCH/USD pair (data feed from Kraken).
· The pair could bounce back once again, but it has to break the $530-540 resistance zone for more gains.
Bitcoin cash price failed near a key resistance at $540 against the US Dollar. BCH/USD has to surpass the 100 hourly SMA to gain bullish momentum.
Bitcoin Cash Price Upside Hurdle
Yesterday, there was a decent recovery in bitcoin cash price above the $500 resistance against the US Dollar. The BCH/USD pair moved higher and broke the $510 and $5220 resistance levels. There was even a spike above the 50% Fib retracement level of the last drop from the $595 high to $473 low. However, the price failed near a key resistance at $540 and the 100 hourly simple moving average.
It started trimming gains and moved below the $525 level. It also broke the 38.2% Fib retracement level of the last wave from the $473 swing low to $541 high. At the moment, the price is trading near the $500-505 support area. There is also an expanding triangle forming with current support at $492 on the hourly chart of the BCH/USD pair. More importantly, the 50% Fib retracement level of the last wave from the $473 swing low to $541 high is acting as a support near $506. As long as the price is above the triangle support and $490, it could bounce once again.
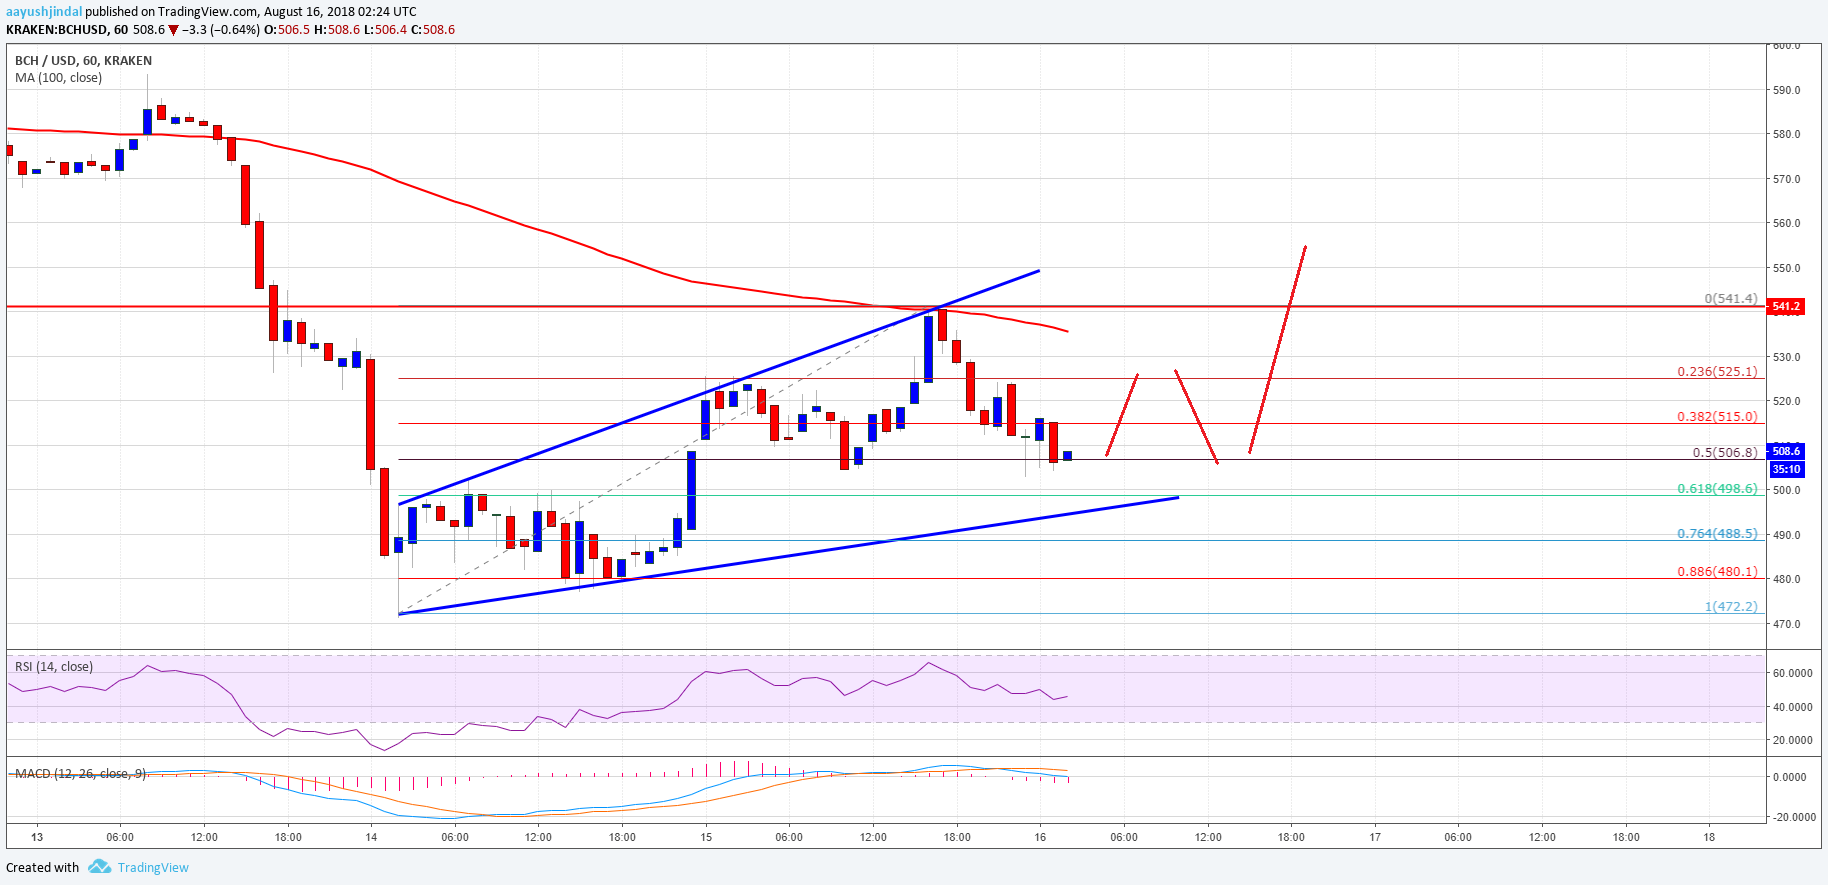
Looking at the chart, BCH price attempted a nice recovery, but failed to clear offers near $540. On the downside, supports are seen at $500, $492, $490 and $480.
Looking at the technical indicators:
Hourly MACD – The MACD for BCH/USD is slightly placed in the bearish zone.
Hourly RSI (Relative Strength Index) – The RSI for BCH/USD is currently just below the 50 level.
Major Support Level – $492
Major Resistance Level – $540
AAYUSH JINDAL | AUGUST 16, 2018 | 4:08 AM