x






Key Points
Bitcoin cash price is moving higher and is currently placed above $650 against the US Dollar.
Yesterday’s highlighted connecting bullish trend line with support at $650 is intact on the hourly chart of the BCH/USD pair (data feed from Kraken).
The pair is showing bullish signs and it seems like it could break $680 to test the $700 handle.
Bitcoin cash price is gaining pace against the US Dollar. BCH/USD is likely to accelerate higher as long as it is above the $650 support level.
Bitcoin Cash Price Support
There was a decent start of an upside wave from the $625 swing low in bitcoin cash price against the US Dollar. The price traded above the $640 and $650 resistance levels to move back in a positive zone. More importantly, the price is now well above the $640 pivot level and the 100 hourly simple moving average. It recently traded as high as $676 before a minor downside correction.
It tested the 23.6% Fib retracement level of the last wave from the $625 low to $676 high. However, the downside was limited and it seems like the price is about to resume its uptrend. A break above the $676 high could push the price towards the last swing high at $685. Above the mentioned $685 level, the price may even test the $700 resistance in the near term. On the other hand, if there is a downside correction, the $650 support may stop losses.
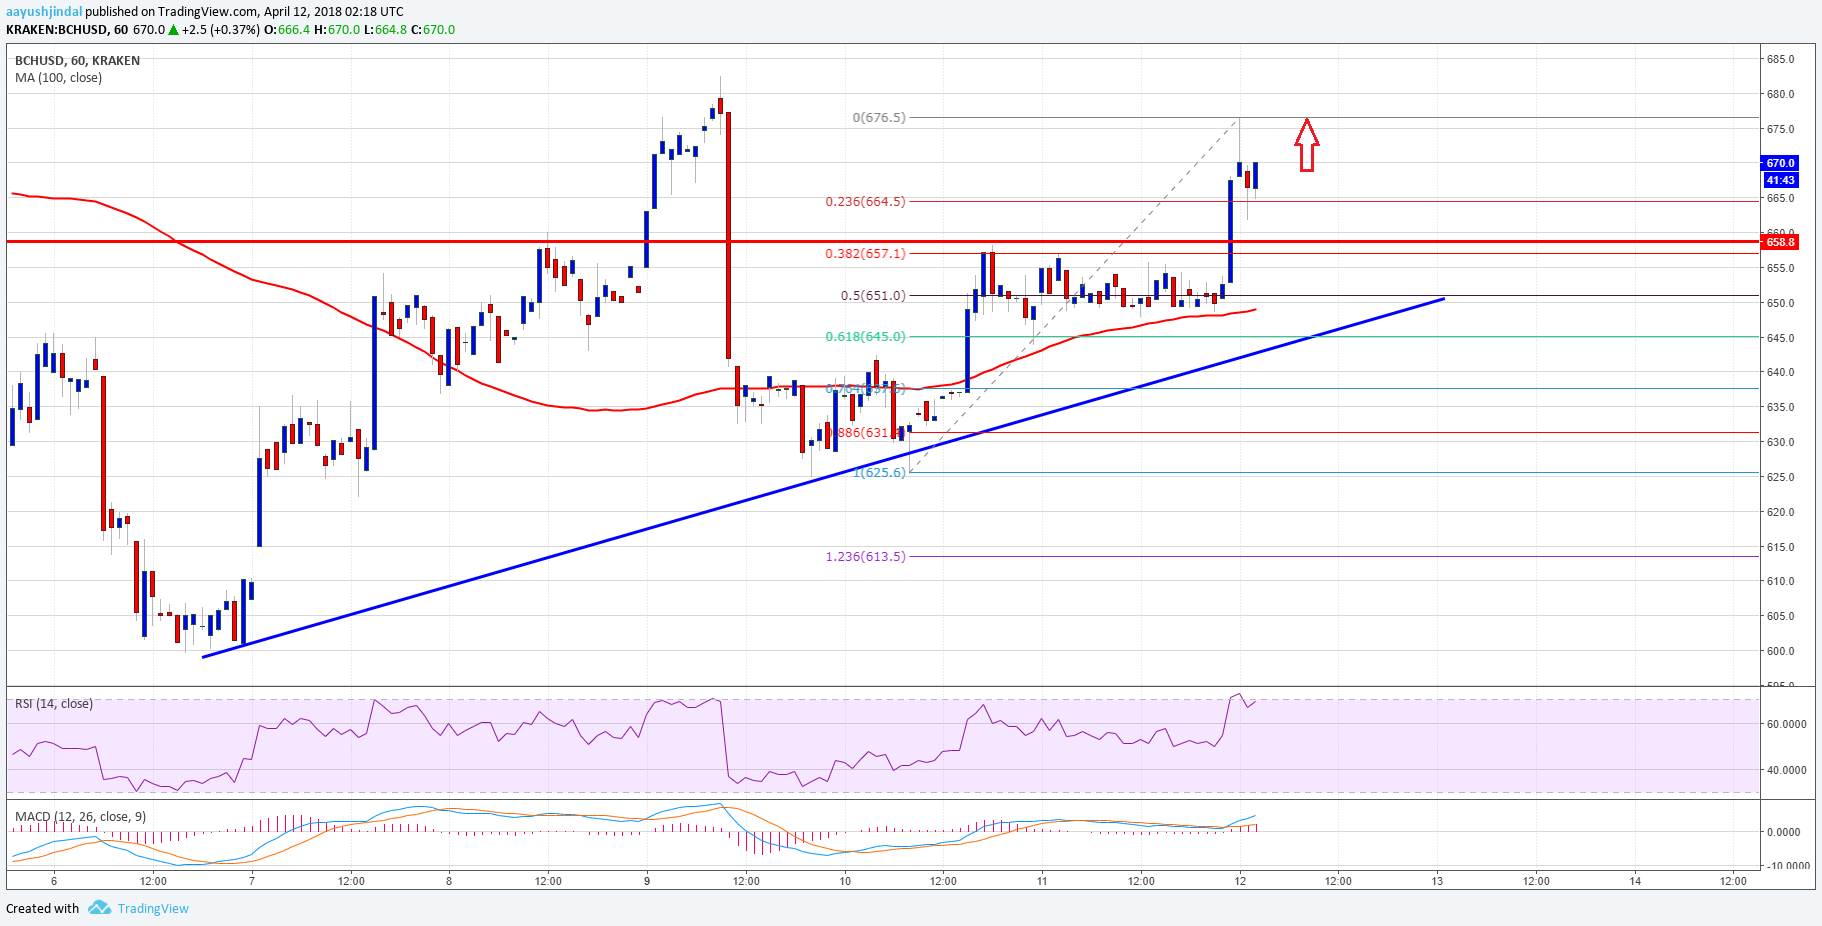
Moreover, yesterday’s highlighted connecting bullish trend line with support at $650 is intact on the hourly chart of the BCH/USD pair. Therefore, the pair remains supported on the downside above the $650 level and it could continue to move higher towards $700.
Looking at the technical indicators:
Hourly MACD – The MACD for BCH/USD is moving nicely in the bullish zone.
Hourly RSI (Relative Strength Index) – The RSI for BCH/USD is currently near the overbought levels.
Major Support Level – $650
Major Resistance Level – $685
Charts courtesy – Trading View
Author: AAYUSH JINDAL | APRIL 12, 2018 | 4:08 AM
Posted by David Ogden Entrepreneur