x





Key Points
Bitcoin cash price struggled to move higher and declined sharply below the $700 level against the US Dollar.
There are two key bearish trend lines forming with resistances near $750 and $850 on the hourly chart of the BCH/USD pair (data feed from Kraken).
The pair may continue to struggle, and it could even trade towards $600 in the near term.
Bitcoin cash price faced a lot of heat and declined sharply against the US Dollar. BCH/USD even traded below he $700 level and it remains at a risk of more losses.
Bitcoin Cash Price Downside
There was a lot of increase in selling pressure, resulting in a push below the $750 support in bitcoin cash price against the US Dollar. The price declined heavily and even broke the $700 level. A low was formed at $679 from where a minor correction was initiated. At the moment, the price is well below the $750 level and the 100 hourly simple moving average.
There are many bearish signs on the chart with a daily close below $750. An initial resistance is around the 23.6% Fib retracement level of the last decline from the $898 high to $679 low. More importantly, there are two key bearish trend lines forming with resistances near $750 and $850 on the hourly chart of the BCH/USD pair. The first trend line is very important since it is near $750 pivot level. Moreover, the 50% Fib retracement level of the last decline from the $898 high to $679 low is also around the trend line.
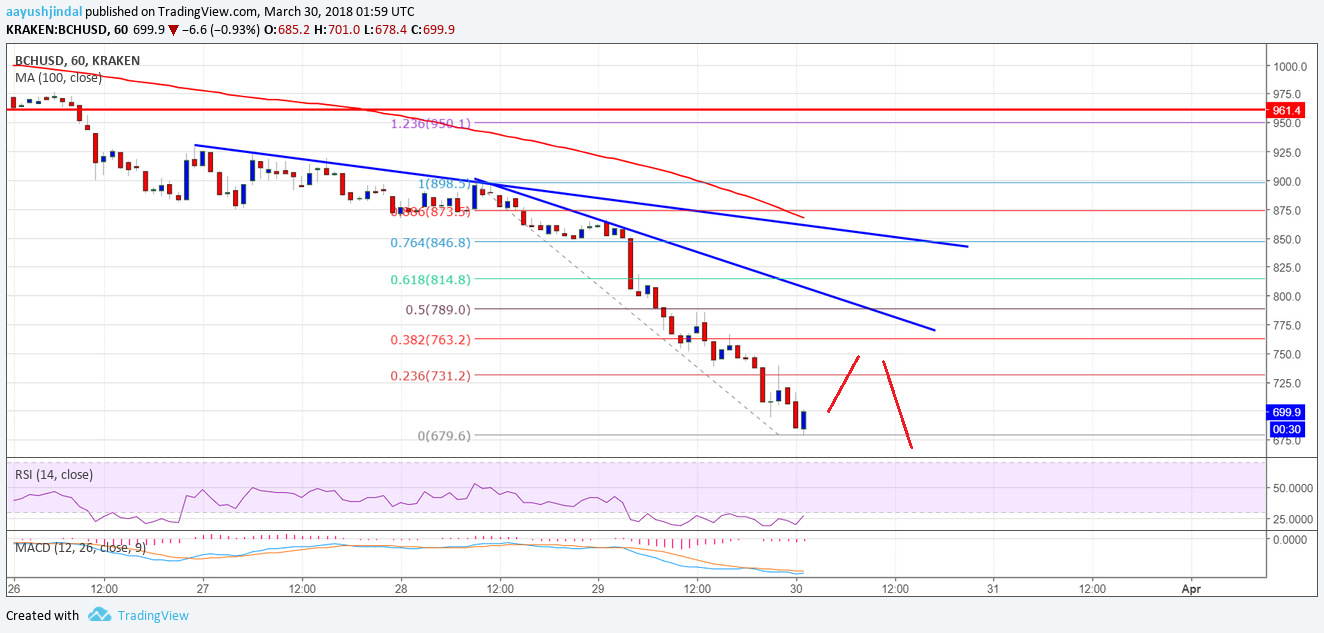
herefore, any upsides are likely to be capped by the $720 and $750 levels. On the downside, the price may soon break the $650 level for more losses.
Looking at the technical indicators:
Hourly MACD – The MACD for BCH/USD is gaining downside momentum in the bearish zone.
Hourly RSI (Relative Strength Index) – The RSI for BCH/USD is now around the 30 level.
Major Support Level – $650
Major Resistance Level – $750
Author AAYUSH JINDAL | MARCH 30, 2018 | 4:08 AM
Posted by David Ogden Entrepreneur