x





Key Points
Bitcoin cash price found support around the $1,565 level and recovered against the US Dollar.
There is a key connecting bearish trend line forming with resistance at $1,700 on the hourly chart of the BCH/USD pair (data feed from Kraken).
The pair has to move above the $1,700 resistance level to continue the current upside wave.
Bitcoin cash price is recovering from lows against the US Dollar. BCH/USD is now facing a major hurdle for more gains near the $1,700 level.
Bitcoin Cash Price Resistance
Yesterday, we saw a downside correction in bitcoin cash price below the $1,650 support against the US Dollar. The price even traded below the $1,600 level and tested the $1,550-60 support area. There was even a spike below the 61.8% Fib retracement level of the last leg from the $1,460 low to $1,835 high. However, the decline was protected by the $1,560 support area.
A low was formed at $1,567 and the price started an upside move. It traded above the 23.6% Fib retracement level of the last decline from the $1,834 high to $1,567 low. Moreover, the price moved above the $1,625 level and the 100 hourly simple moving average. At the moment, the price is approaching a major hurdle near the $1,700 level. There is also a key connecting bearish trend line forming with resistance at $1,700 on the hourly chart of the BCH/USD pair. Additionally, the 50% Fib retracement level of the last decline from the $1,834 high to $1,567 low is at $1,705 to prevent gains.
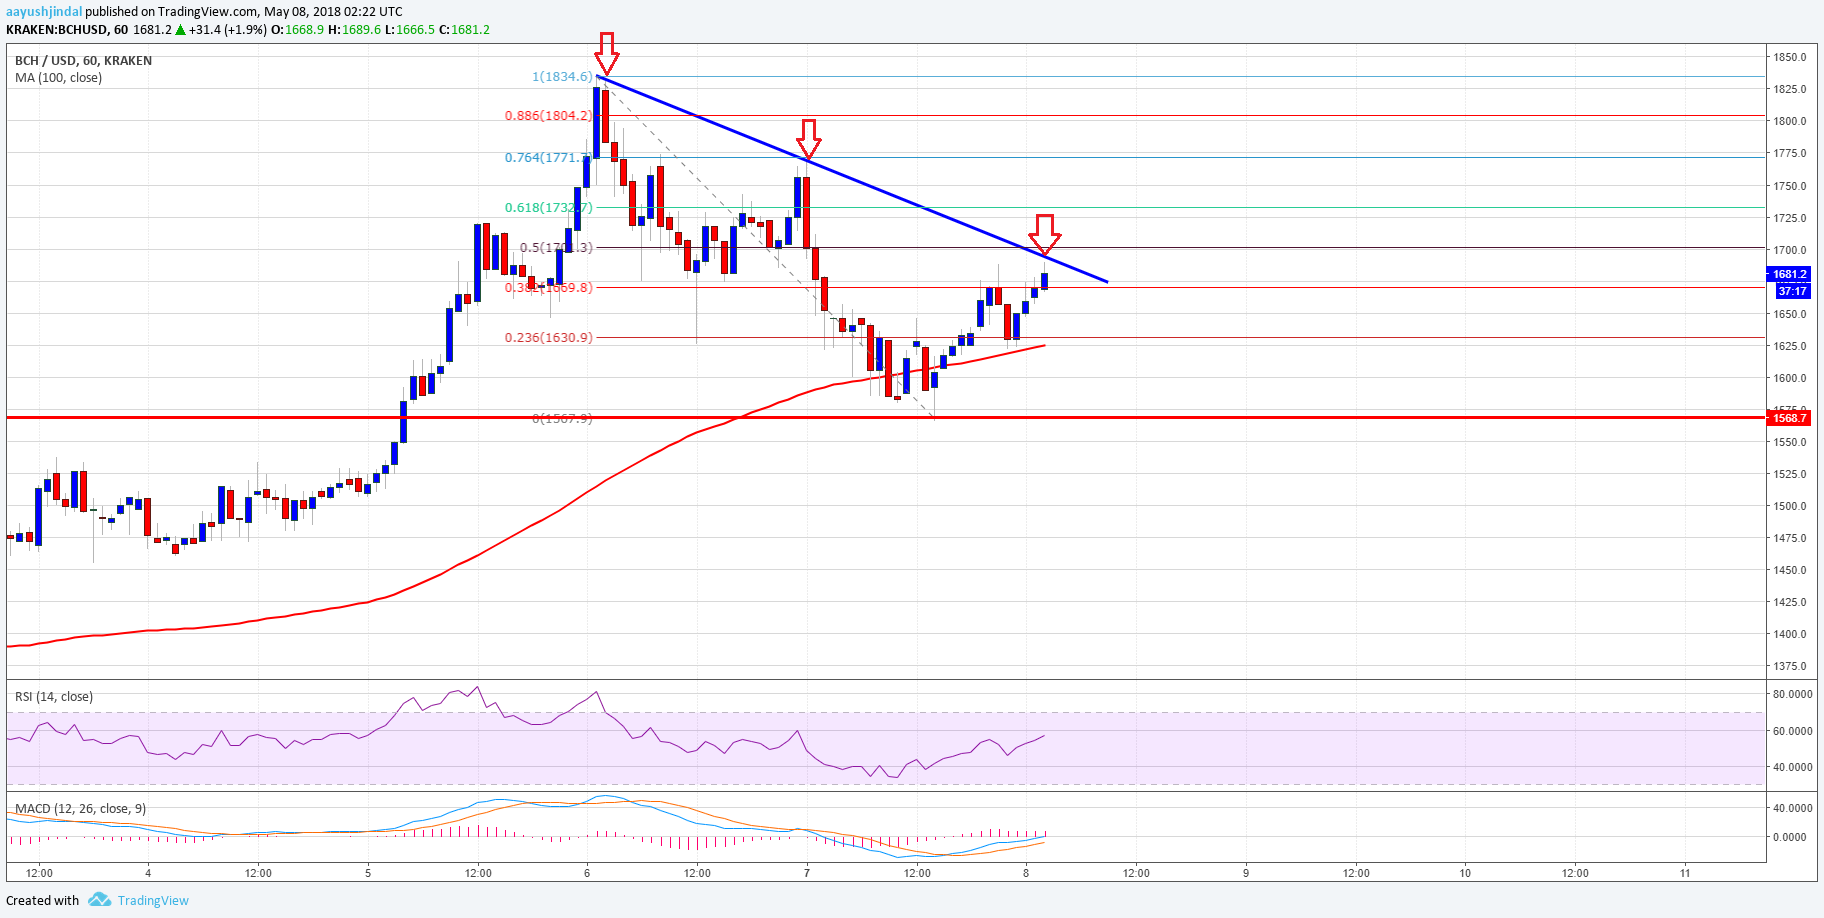
Looking at the chart, it seems like it won’t be easy for buyers to break the $1,700 barrier. On the downside, the $1,625 support is a decent buy zone along with the 100 hourly SMA.
Looking at the technical indicators:
Hourly MACD – The MACD for BCH/USD is slightly in the bullish zone.
Hourly RSI (Relative Strength Index) – The RSI for BCH/USD has moved above the 50 level.
Major Support Level – $1,625
Major Resistance Level – $1,700
Author AAYUSH JINDAL | MAY 8, 2018 | 4:08 AM
Posted by David Ogden entrepreneur