x




Key Points
Bitcoin cash price is back in a positive zone and $1,000 with bullish signs against the US Dollar.
There was a break above a crucial bearish trend line with resistance near $980 on the 4-hours chart of the BCH/USD pair (data feed from Kraken).
The pair is now above the $1,040 level and the 100 simple moving average (4-hours).
Bitcoin cash price is gaining bullish momentum above $1,000 against the US Dollar. BCH/USD has to move above $1,100 to accelerate gains in the near term.
Bitcoin Cash Price Trend
This past week, there were mostly range moves below $1,040 in bitcoin cash price against the US Dollar. The price was struggling to gain pace above the $1,020 and $1,040 resistance levels. Finally, there was an upside break and the price settled above the $1,040 level and the 100 simple moving average (4-hours). During the upside move, the price broke many hurdles, including the $1,000 barrier.
Moreover, there was a break above the 38.2% Fib retracement level of the last decline from the $1,323 swing high to $871 low. More importantly, there was a break above a crucial bearish trend line with resistance near $980 on the 4-hours chart of the BCH/USD pair. The pair is now placed nicely in a positive zone above $1,040. At the moment, the 50% Fib retracement level of the last decline from the $1,323 swing high to $871 low at $1,096 is acting as a resistance. A break and close above $1,100 is needed for more gains towards $1,200.
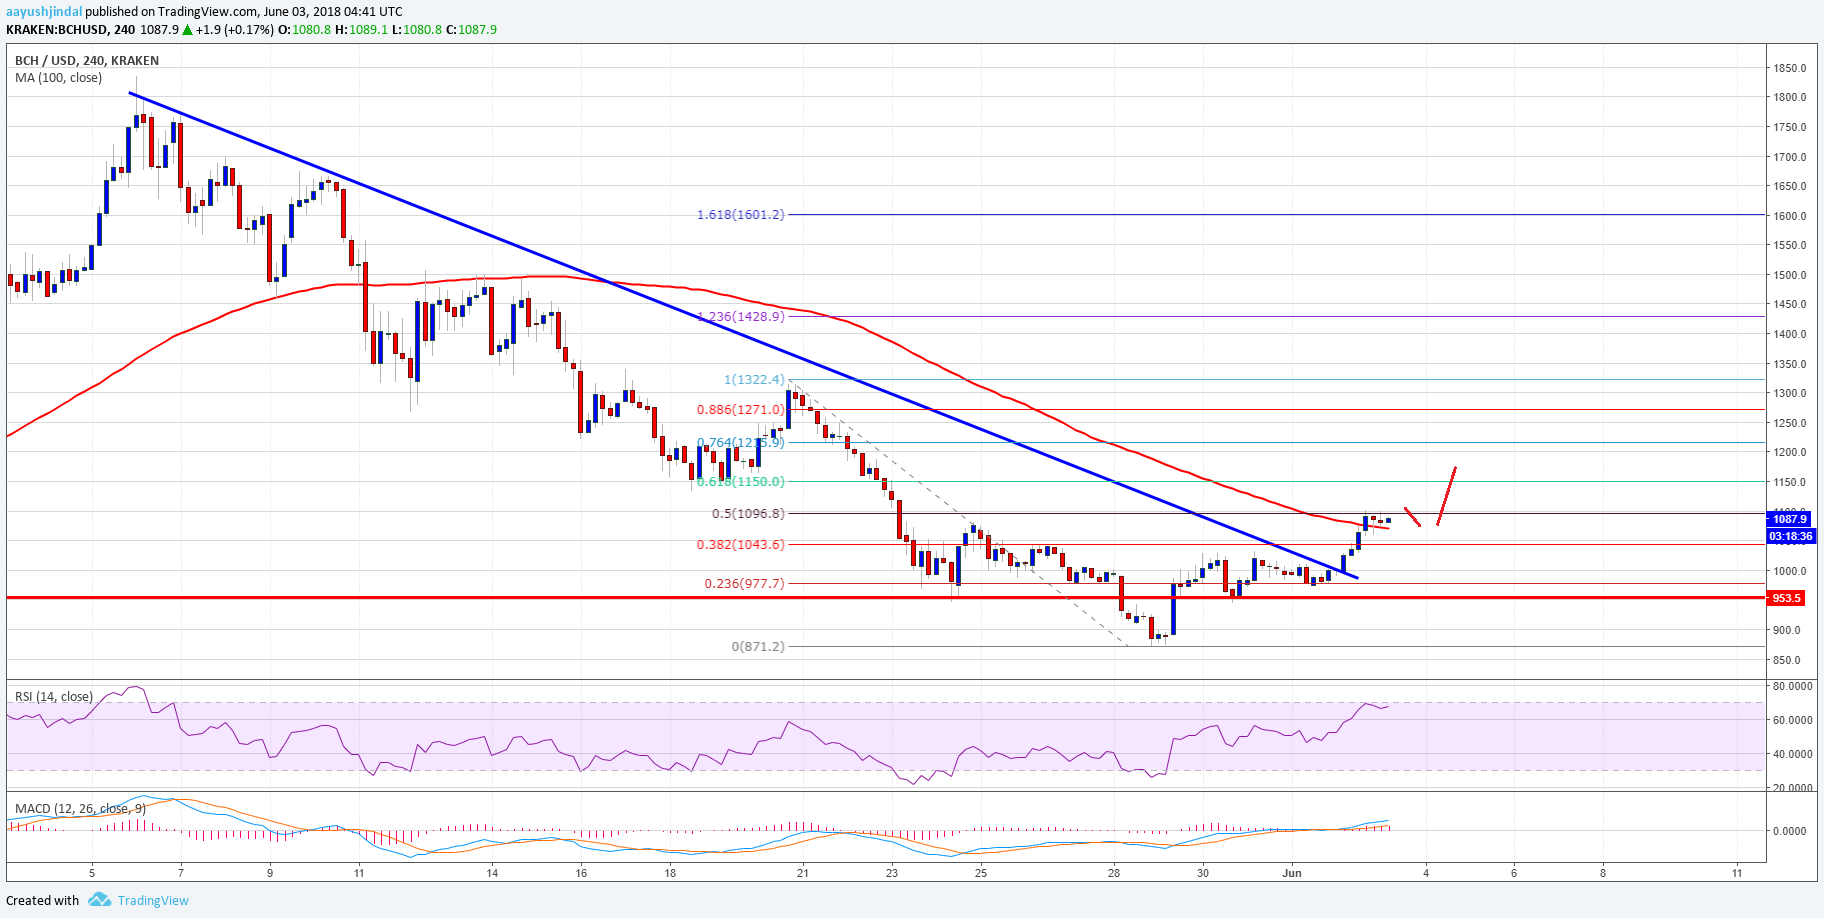
Looking at the chart, the price action is positive above $1,000. On the downside, the broken resistances at $1,040 and $1,000 are likely to act as supports if the price moves down.
Looking at the technical indicators:
4-hours MACD – The MACD for BCH/USD is gaining momentum in the bullish zone.
4-hours RSI (Relative Strength Index) – The RSI for BTC/USD is now well above the 60 level.
Major Support Level – $1,000
Major Resistance Level – $1,100
Author AAYUSH JINDAL | JUNE 3, 2018 | 5:08 AM
Posted by David Ogden Entrepreneur