x



BTC/USD retreated below $12,000 after a short-lived spike above $13,000
Intraday RSI implies that the sell-off is not over yet.
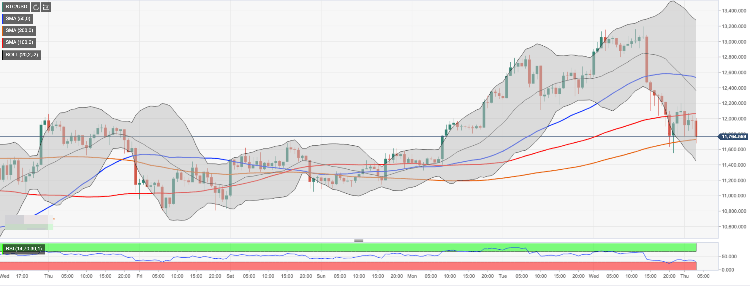
Bitcoin is changing hands at $11,850 after a strong sell-off from the recent high of $13,195. The first digital currency lost over $1,000 of its value in a matter of hours and settled under $12,000 to much disappointment of BTC bull that expected to see it at new 2019 highs. BTC/USD has lost over 8% in recent 24 hours and nearly 3% since the beginning of Asian trading on Thursday. All major altcoins have also extended the decline.
While the fundamental reasons behind the sell-off remain unknown, it is worth noting that the move was accompanied by a spike in trading volumes, which means that traders were locking profits after a strong upside move
Bitcoin's technical picture
The initial resistance for BTC/USD comes at $12,000. This psychological barrier is strengthened by SMA100 (Simple Moving Average) on the 1-hour chart. It is followed by the middle line of the 1-hour Bollinger Band at $12,360 and SMA50 (1-hour) at $12,550.
Once this barrier is cleared, the recovery may be extended towards $13,000 and $13,300 (upper boundary of 1-hour Bollinger Band).
On the downside, the initial support lies at $11,600 created by SMA100 4-hour. This barrier is followed by $11,300 (the lower boundary of 4-hour Bollinger Band) and psychological $11,000. Considering the downward-looking RSI (Relative Strength Index) on the intraday charts, further sell-off towards the above said support area looks likely.
BTC/USD, 1-hour chart
Tanya Abrosimova
FXStreet