x




The resistance at $8,300 has stopped the recovery.
The short-term sellers pushed Bitcoin back below critical $8,000.
BTC/USD is hovering below $8,000 after an initial attempt to settle above $8,300 during early Asian hours. The first digital coin as lost over 3% of its value since the beginning of the day, though it is still in the green zone on a day-on-day basis. At this stage, the recovery from the recent lows has stalled, but the coin is still moving within the long-term bullish trend with 4.5% of gains on a day-on-day basis.
Bitcoin's technical picture
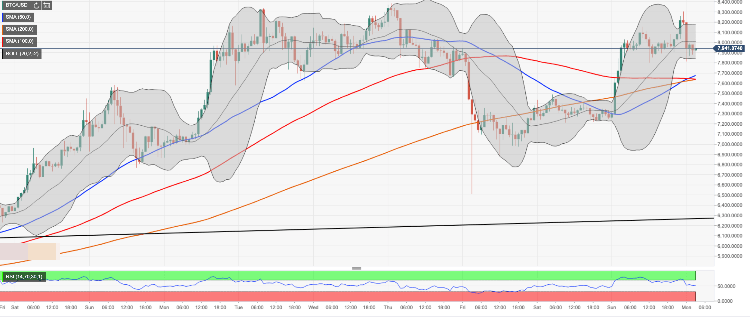
On the intraday charts, Bitcoin's recovery is capped by the psychological $8,300. This resistance area is strengthened with the upper boundary of 4-hour Bollinger Band (currently at $8,276) and the intraday high of $8,304. Once it is cleared, the upside is likely to gain traction with the next focus on the previous week high of $8,384 followed by the upper boundary of the daily Bollinger Band at $8,770.
On the downside, the local support is seen at $7,800 handle with the intraday low marginally above this level. A sustainable move lower will trigger more sell-off with the next aim at $7,650 with SMA50 4-hour on approach and a confluence of SMA100 and SMA200 (1-hour) right below this handle.
BTC/USD, 1-hour chart
Tanya Abrosimova
FXStreet