x




Bitcoin’s volatility grew by 200%.
The upside trend is gaining traction with the next focus on $5,560.
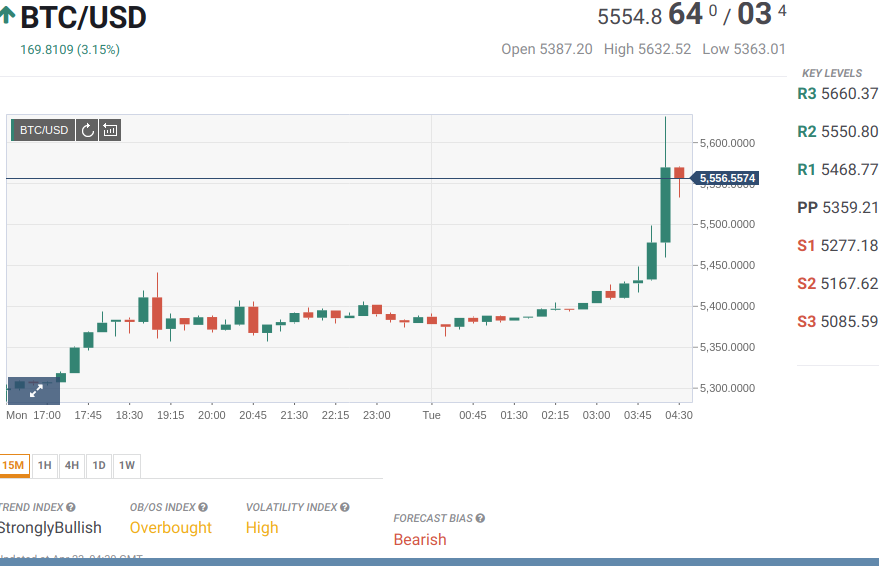
Bitcoin, the largest and the most popular cryptocurrency out there, is changing hands at $5,400. BTC/USD bottomed out at $5,214 on April 21 and has been moving upwards ever since. The coin touched $5,441 high during late Monday session, but failed to hold the ground above $5,400.
The Bitcoin volatility jumped nearly 200% in the recent month. Thus, following the price growth in the beginning of April, the volatility jumped from 1.26% to 3/31% in just two days. Since that time, the Bitcoin has been trading in a narrow range limited by $4 900 and $5 400 boundaries. At the time of writing, the daily volatility of the first digital asset reached 3.54%, which is the highest level in recent three months.
It is worth mentioning, that the Bitcoin’s volatility has been sliding slowly during several years. It is reduced by 98% in 2018.
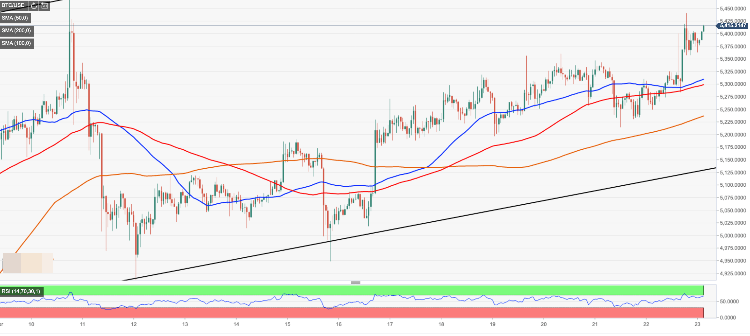
On the intraday charts, BTC/USD is moving within an upside trend. The Relative Strength Index points to the North, which is consistent with the bulls’ case scenario. A sustainable move above the recent high will take us towards $5,500 handle and to $5,560, which is the highest level since November, 19, 2018.
On the downside, the initial support is created by the intraday low $5,363. Once below, the sell-off may continue towards $5,300 supported by SMA50 and SMA100 (1-hour). The next barrier is created by SMA200 at $5,235 and the lower boundary of the recent upside channel at $5,140.
BTC/USD, 1-hour chart
Tanya Abrosimova
FXStreet