x




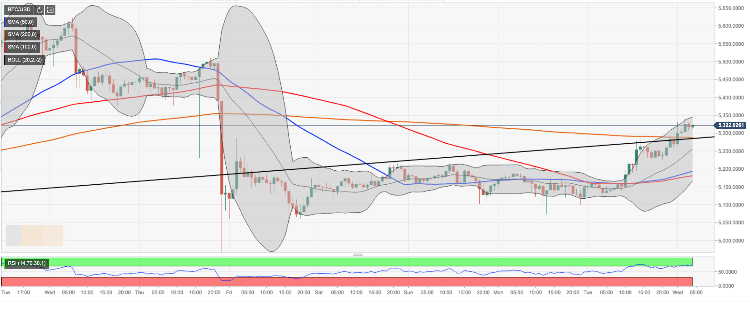
BTC/USD bulls try to hold the ground above critical support.
The critical resistance lies with $5,500.
BTC/USD is changing hands at $5.330, nearly 3% higher from this time on Tuesday. The first digital coin managed to break above several strong resistance levels and return the range of the previous week. While the coin is nearly 4% lower on a week-on-week basis, a sustainable move above $5,300 has improved the technical picture and mitigated an immediate bearish pressure.
Bitcoin’s short-term technical picture
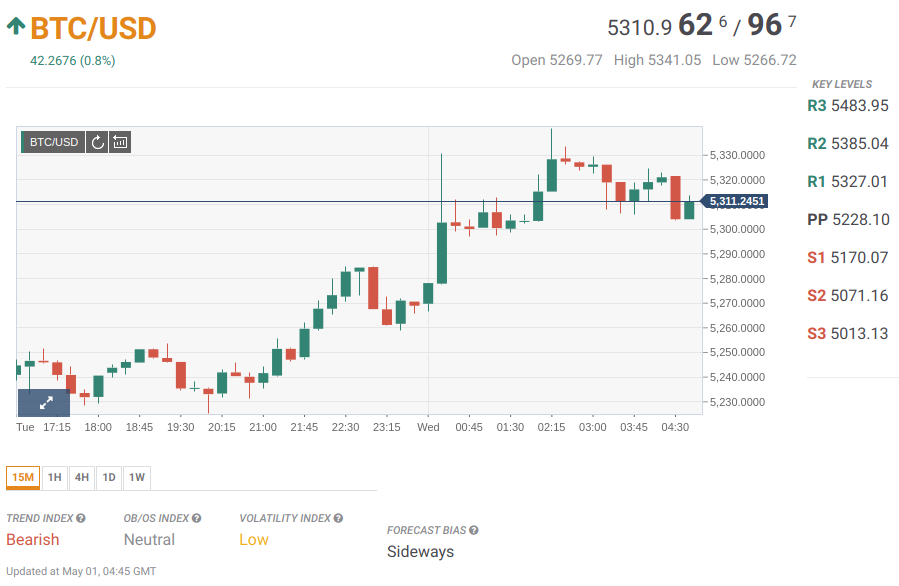
On the intraday charts, BTC/USD has settled above the previously broken channel support and SMA200 (1-hour) clustered under $5,300 handle. While the further upside is capped by $5,344 (the upper boundary of 1-hour Bollinger Band, the short-term trend remains bullish as long as $5,250 remains intact.
On the upside, t we will need to see BTC above $5,500 to say that the downside correction is over that the coin is ready to resume the upside movement. However, the Relative Strength Index on intraday charts has started to reverse from an overbought territory, which means that the coin may extend the downside towards the above-said support of $5,250 before the growth is resumed.
BTC/USD, 1-hour chart
Tanya Abrosimova
FXStreet