x



The Rundown
Bitcoin Price Doji Turns Bearish
Bitcoin Dominance Still Raging
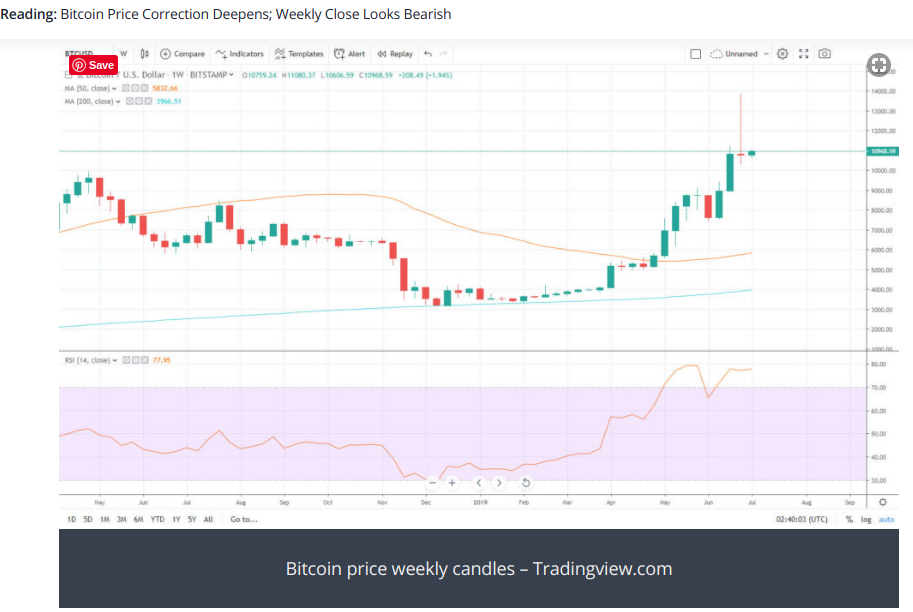
The Bitcoin price pullback which began at the end of last week has accelerated this Monday morning despite a relatively stable weekend. The weekly candle has closed off with a bearish signal indicating further losses could be coming.
BITCOIN PRICE DOJI TURNS BEARISH
Bitcoin price has been in decline for the past 24 hours following a weekend push back over $12k. The slide led to a drop of over a thousand dollars, or around 8%, in BTC price as the correction appears to be deepening. On the hourly chart Bitcoin price has dropped below both the 50 and 200 moving averages and is currently just above $11000, trading at $10930.9 +0.56%.
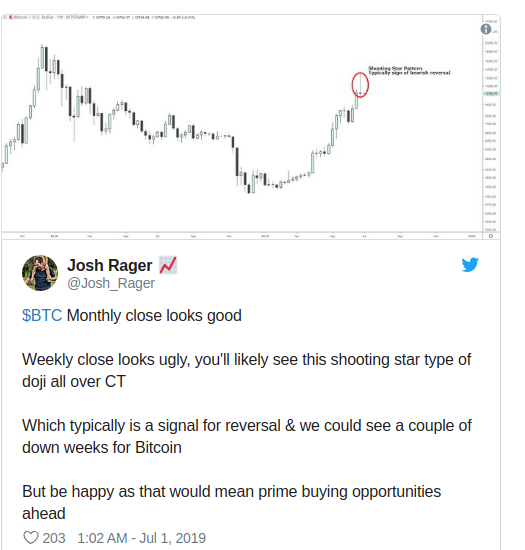
The weekly chart, however, looks a little more ominous as a large doji, or shooting star has appeared which is often the sign of indecision between buyers and sellers leading to a possible trend reversal. Trader Josh Rager noticed this and while analyzing the charts, he added that a couple of weeks on the downside would lead to prime buying opportunities.
“$BTC Monthly close looks good. Weekly close looks ugly, you’ll likely see this shooting star type of doji all over CT. Which typically is a signal for reversal & we could see a couple of down weeks for Bitcoin. But be happy as that would mean prime buying opportunities ahead,”
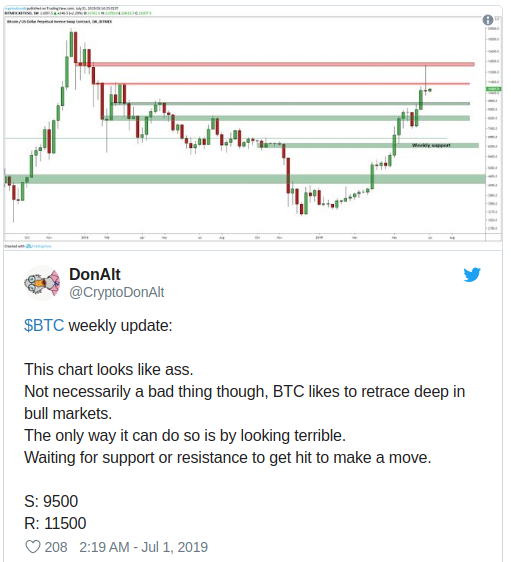
Looking at the daily chart, support lies at the 50-day moving average which is at the $9000 level. Many have talked about a dip of over 30 percent which has yet to materialize. At the moment BTC price is down around 20% from its recent high so a further ten percent drop or more would take it to the mid $9,000s which is also where the purported support lies. Trader ‘DonAlt’ also agrees that Bitcoin price often retraces deep in bull markets.
“$BTC weekly update: This chart looks like ass. Not necessarily a bad thing though, BTC likes to retrace deep in bull markets. The only way it can do so is by looking terrible. Waiting for support or resistance to get hit to make a move.”
BITCOIN DOMINANCE STILL RAGING
Bitcoin dominance is still over 60% as altcoins are getting crushed again. Total market capitalization has shrunk by $25 billion over the past day or so as everything is getting pulled into the crypto quagmire.
Most experienced traders are in agreement that this is a healthy movement for markets. Many will be keenly eyeing these support levels for new entry positions for the next leg up.
MARTIN YOUNG | JUN 30, 2019 | 23:32