x




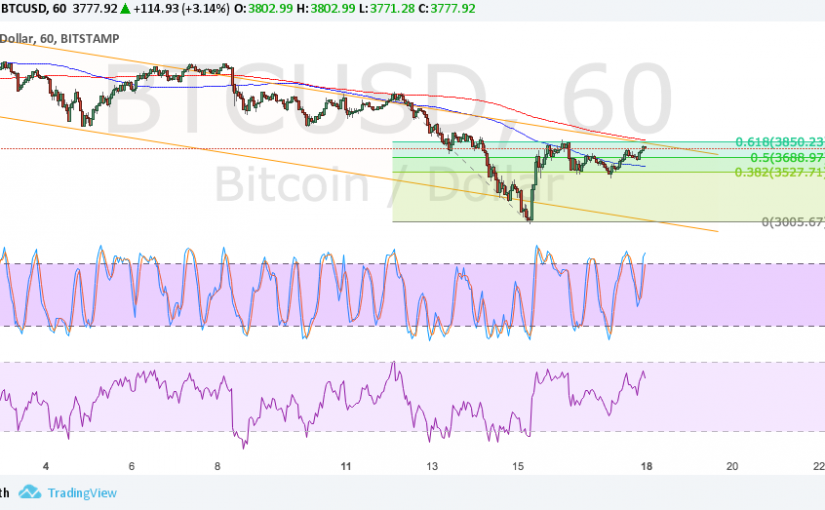
Bitcoin price is making a correction from its recent selloff, but it might be ready to resume the drop soon.
Bitcoin Price Key Highlights
Technical Indicators Signals
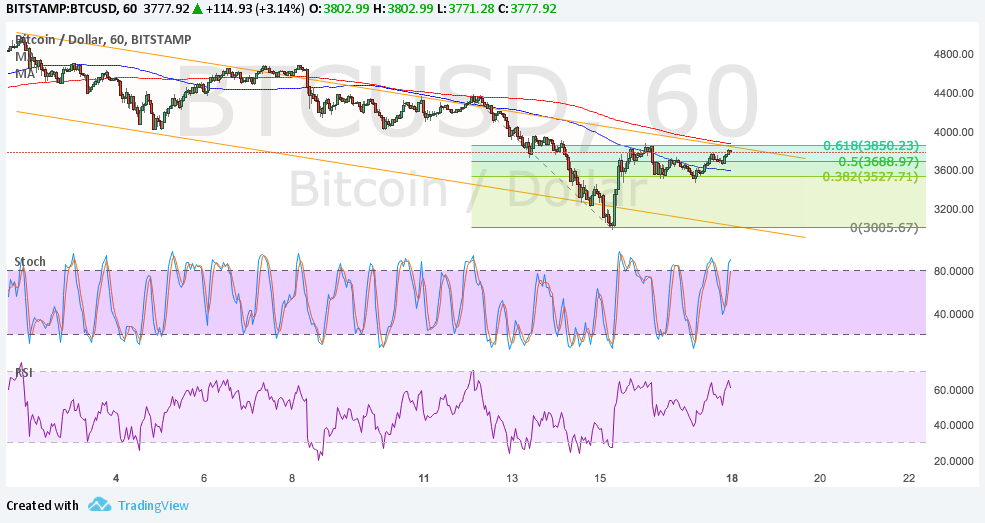
The 100 SMA is below the longer-term 200 SMA on this time frame, so the path of least resistance is to the downside. The 200 SMA dynamic resistance lines up with the channel resistance around $3850 and the 61.8% Fibonacci retracement level, adding to its strength as a ceiling.
However, there’s also another area of interest located at the $4000 psychological level, which held as support in the past. This could serve as the line in the sand for this correction and a break past the level could indicate that buying pressure is back in the game.
Stochastic is still pointing up so there’s some bullish momentum left. RSI is also heading north so bitcoin price might follow suit. If the selloff resumes, bitcoin could drop to the swing low near $3000 or form new ones closer to the channel support at $2800.
Market Factors
News that BTC China would be halting trading for its clients by the end of the month pretty much sealed the deal for speculations that the world’s largest bitcoin market would see a large drop in activity. Liquidation has been taking place for the most part of the previous week and this would likely carry on in the coming days.
As for the dollar, the focus has been on tax reform, which has been bullish for the fiat currency. Easing fears of a North Korea missile strike have also weighed on bitcoin price as this is often treated as digital gold during risk-off days. Meanwhile, the upcoming FOMC decision could still be a risk factor for BTCUSD as downbeat remarks could lead to a selloff for the dollar.
4:26 am September 18, 2017
Author Sarah Jenn
Posted by David Ogden Entrepreneur