x





Bitcoin Price Key Highlights
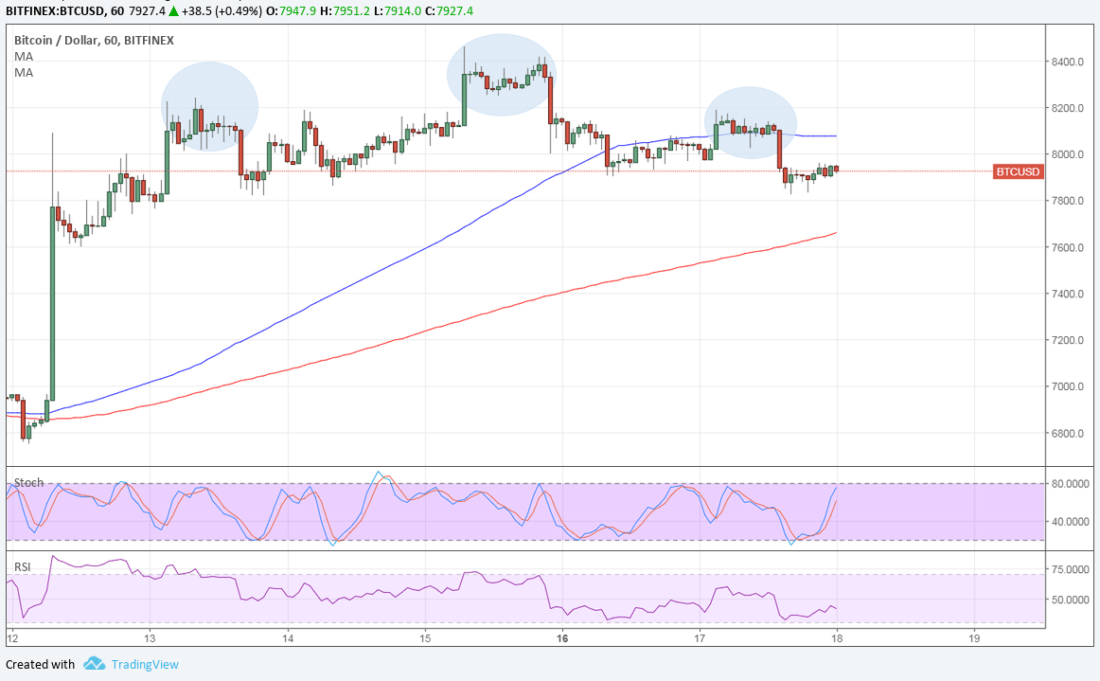
Bitcoin price formed a short-term head and shoulders pattern, which is a classic selloff signal.
Technical Indicators Signals
The 100 SMA is still above the longer-term 200 SMA on the 1-hour time frame to indicate that the path of least resistance is to the upside. In other words, the uptrend is more likely to resume than to reverse.
Bitcoin price has broken below the 100 SMA dynamic support, though, so selling pressure could be picking up. Price could test support at the 200 SMA dynamic inflection point around $7600 next. The gap between the two is narrowing to signal weakening bullish momentum.
The head and shoulders pattern spans $7750 to $8400 so the resulting drop could be of the same height. If the current support levels hold, bitcoin price could recover to the shoulders around $8200 or past the head at $8400.
Stochastic is pointing up to show that there’s some bullish pressure left, but this oscillator is nearing overbought levels to reflect exhaustion among buyers. RSI is just starting to make its way out of the oversold region to signal a return in bullish momentum.
Market Factors
Traders had been expecting a strong rebound in bitcoin price after the tax deadline has passed, but it looks like market watchers are holding out for more clues. Sentiment has mostly been positive, coming off reports that big hedge funds are ready to place bets on the industry and the acquisition of Earn.com by Coinbase.
Dollar demand has been able to stay supported in recent sessions thanks to mostly upbeat economic data and hawkish Fed commentary. Easing geopolitical tensions have also lifted US bond yields, drawing traders back to the US currency as well.
Nonetheless, Q2 has historically been a positive quarter for bitcoin price and traders would likely try to take advantage of this tendency.
Author SARAH JENN | APRIL 18, 2018 | 4:31 AM
Posted by David Ogden Cryptocurrency Entrepreneur