x





Bitcoin Price Key Highlights
Technical Indicators Signals
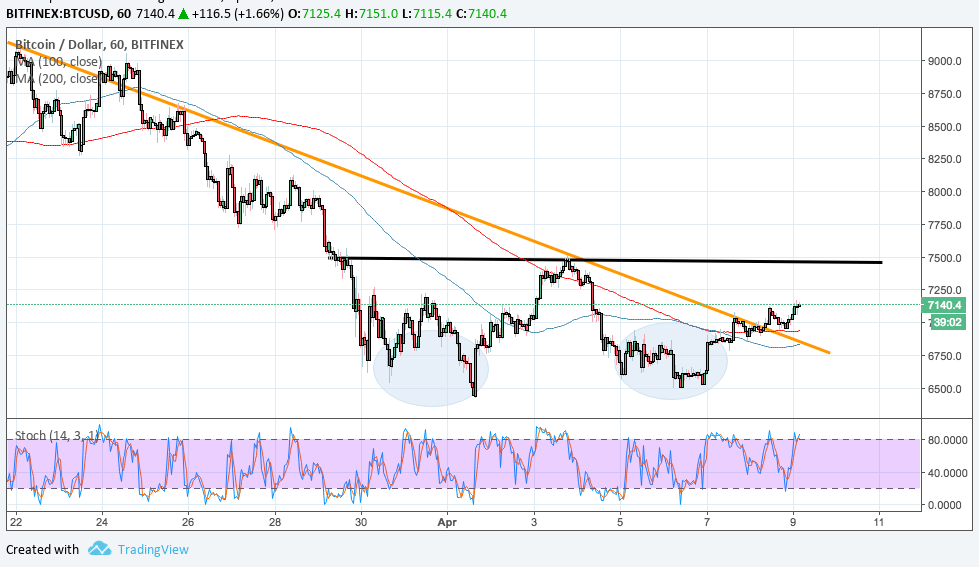
The 100 SMA is still below the longer-term 200 SMA to signal that the path of least resistance is to the downside. This means that the downtrend is more likely to resume than to reverse.
However, bitcoin price has also broken past the moving averages’ dynamic inflection points to reflect a pickup in bullish momentum. It has also moved past a short-term descending trend line to indicate that buyers are in control.
From here, bitcoin price could make its way up to the double bottom neckline at the $7500 mark to possibly push for a stronger climb. A break past this resistance could mean a climb of the same height as the chart formation, which spans $6500 to $7500.
Stochastic is on the move up to signal the presence of bullish pressure, but the oscillator is approaching overbought levels to hint at potential exhaustion as well. If resistance holds, another bottom at $6500 could be formed.
Market Factors
Dollar weakness came in play towards the end of the previous week as risk-taking stayed supported while weak NFP data dampened tightening hopes.
Besides, a change in tone from renowned trader George Soros regarding bitcoin also propped the industry higher. Soros Fund Management recently announced that the enterprise had received permission to begin trading cryptocurrencies within the next few months
.
To top it off, the venture capital firm Venrock has partnered with Brooklyn-based cryptocurrency firm Coinfund, also marking a significant step forward and points for approval for cryptocurrencies in general.
Author: SARAH JENN | APRIL 9, 2018 | 4:36 AM
Posted by David Ogden Entrepreneur