x





Bitcoin Price Key Highlights
Bitcoin price has bounced off the area of interest previously highlighted to signal that the selloff would resume.
Applying the Fibonacci extension tool shows how low bitcoin could go from here.
Technical indicators are showing mixed signals, with the oscillators reflecting more bearish pressure.
Bitcoin price is bouncing off the downtrend line and looks ready to resume the drop to new lows.
Technical Indicators Signals
The 100 SMA is below the longer-term 200 SMA to confirm that the path of least resistance is to the downside or that the selloff is more likely to continue than to reverse. The 200 SMA also lines up with the downtrend line to add to its strength as a ceiling.
However, the gap between the moving averages is narrowing to signal a potential upward crossover or return in bullish momentum. The 100 SMA might also be able to hold as dynamic support. If so, a move past the trend line, swing high and $9000 mark could confirm that an uptrend is taking place.
RSI is turning lower to show that sellers have the upper hand. Stochastic has also made its way out of the overbought zone and is heading south, so bitcoin price might follow suit. The 38.2% extension is at the $8400 area and the 50% level is close to the swing low. Stronger selling momentum could take bitcoin price to the 78.6% extension at $7913 or the full extension at $7650.
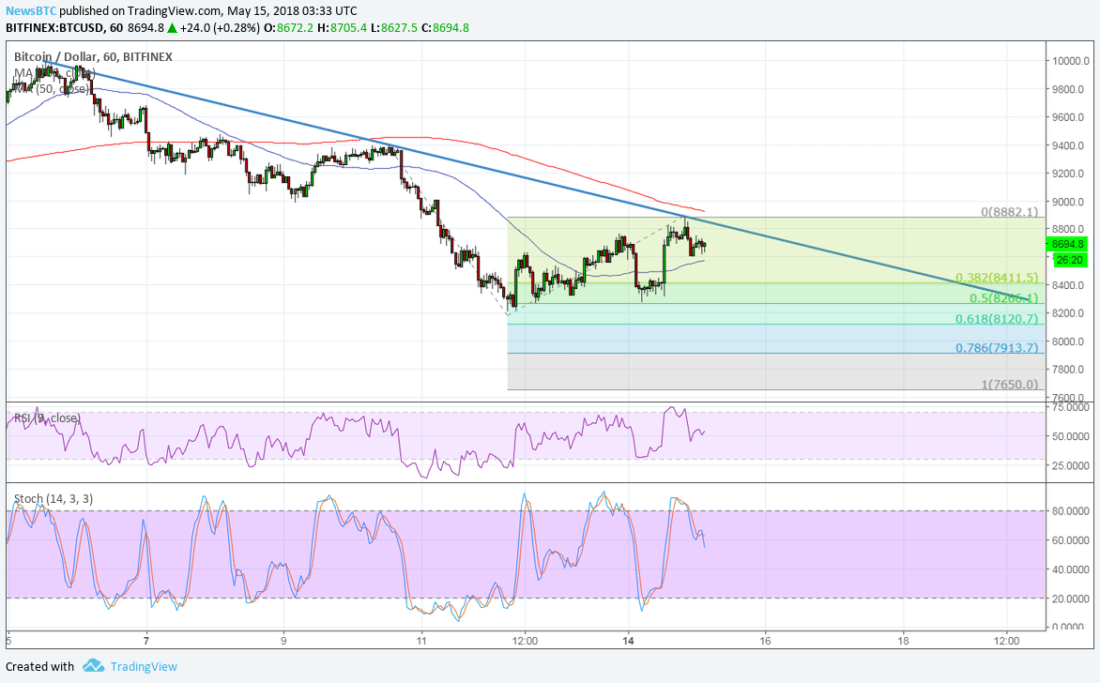
BTC/USD 1-hour Chart from TradingView
Market Factors
Bitcoin price seems to be off to another shaky start for the week as another failed attempt at breaking past $9,000 has drawn more selling pressure and spooked some bulls. However, positive updates in the industry are still popping up and could ultimately allow the climb to resume.
At the moment, what’s keeping investors on edge is the possibility that Mt. Gox will short another set of bitcoin to pay off its creditors. An estimated 8,000 coins are still up for selling, so this could have a huge weight on price.
Source: https://www.newsbtc.com/2018/05/15/bitcoin-price-watch-low-can-btc-go/
Posted by Daving Ogden Entrepreneur