x



Bitcoin price formed a support base near $3,370 and recovered higher above $3,450 against the US Dollar.
There was a break above a major contracting triangle with resistance at $3,440 on the 4-hours chart of the BTC/USD pair (data feed from Kraken).
The pair seems to be approaching a couple of important resistances near $3,500 and $3,510.
Bitcoin price is slowly moving higher with positive signs against the US Dollar. However, BTC/USD is now approaching a significant hurdle near the $3,500 resistance zone.
Bitcoin Price Analysis
This past week, bitcoin price remained in a bearish zone below the $3,500 resistance against the US Dollar. The BTC/USD pair tested the $3,375 support area on the couple of occasions and later bounced back. The pair moved above the $3,400 and $3,420 resistance levels to start a decent recovery. The price also traded above the 23.6% Fib retracement level of the last decline from the $3,673 high to $3,346 low. There was a positive price action developed above the $3,440 resistance level.
Moreover, there was a break above a major contracting triangle with resistance at $3,440 on the 4-hours chart of the BTC/USD pair. The price spiked above the $3,475 resistance level, but it remained well below the 100 simple moving average (4-hours). Besides, there was no test of the 50% Fib retracement level of the last decline from the $3,673 high to $3,346 low. Buyers failed to clear the $3,500 resistance area, which ignited bearish moves. At the outset, the price is trading near the $3,440 level, with supports near $3,420 and $3,400. If there is a downside break below $3,400, the price is likely to test the $3,350 and $3,320 levels.
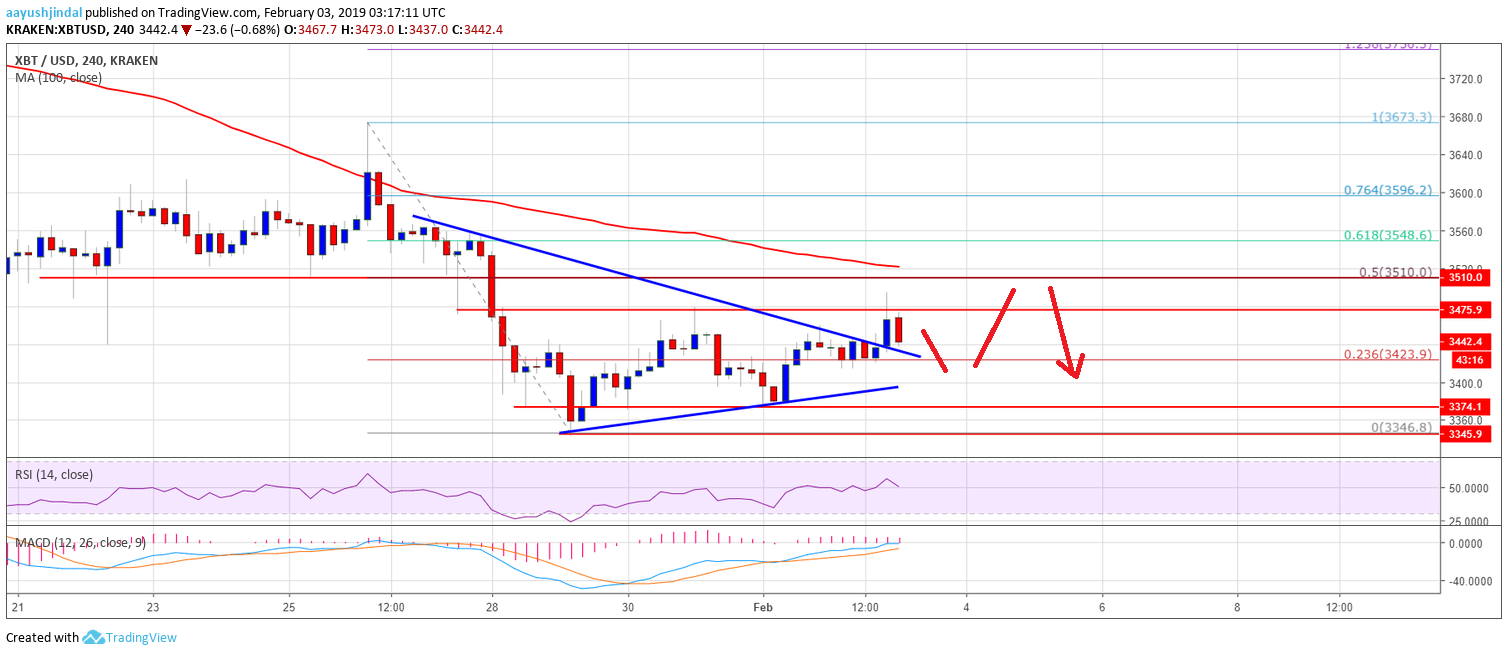
Looking at the chart, BTC price is clearly facing a solid resistance near the $3,500 level and the 100 SMA. As long as the price is trading below $3,500, there is a risk of a downside break in the near term.
Technical indicators
4-hours MACD – The MACD for BTC/USD is slightly placed in the bullish zone.
4-hours RSI (Relative Strength Index) – The RSI for BTC/USD is currently well above the 50 level.
Major Support Level – $3,400
Major Resistance Level – $3,500
AAYUSH JINDAL | FEBRUARY 3, 2019 | 5:00 AM